Beyond the Basics: Flexible Visualization with NG2-Charts
Chart.js stands out as one of the most widely adopted visualization libraries within the open-source community. It integrates flawlessly with Vanilla JavaScript and offers dedicated extensions for leading frameworks including React, Angular, and Vue. For a deeper exploration of its capabilities, the awesome-chartjs collection is an excellent starting point. This discussion centers on the extensive customization potential offered by the options parameter in chart.js.
While integrating chart.js directly into an Angular project is possible, leveraging the community-maintained NG2-CHARTS plugin is the recommended approach. This wrapper library allows developers to work with chart.js seamlessly through native TypeScript code within the Angular environment.
Instructions for setting up ng2-charts can be found at this documentation page.
Let's delve into the practical aspects of customization:
In an Angular context, the options parameter for ng2-charts is typically defined as follows:
pieChartOptions: ChartOptions = {
 responsive: true,
 legend: { position: "top" },
 plugins: {
  datalabels: {
   formatter: (value, ctx) => {
    const label = ctx.chart.data.labels[ctx.dataIndex];
    return label;
   },
  },
 },
};
With this configuration, the chart displays standard labels directly on the slices or segments representing each data point.
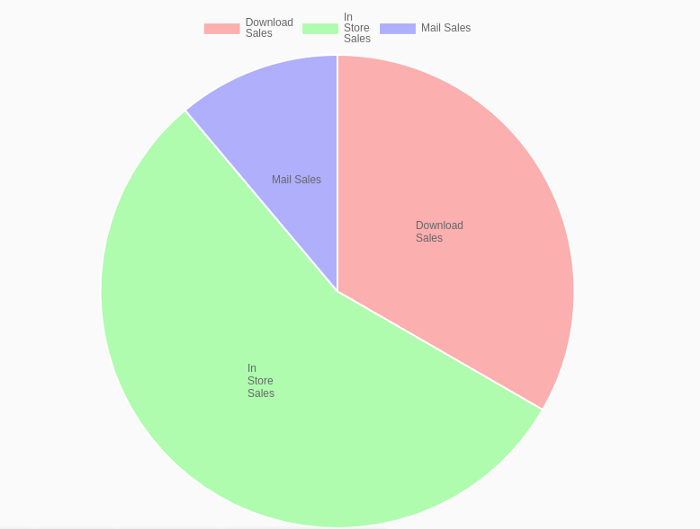
Suppose you want to alter this behavior to display percentage values instead, indicating how much each segment contributes to the whole:
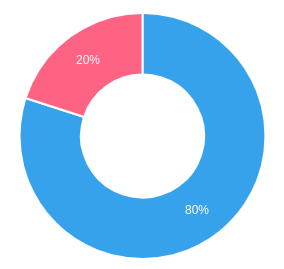
To achieve this, you must modify the formatter function located within the plugins section for data labels:
ChartOptions: ChartOptions = {
 responsive: true,
 tooltips: {
  enabled: true,
  callbacks: {
   label: function (tooltipItem, data) {
    let label = data.labels[tooltipItem.index];
    let count = data
                .datasets[tooltipItem.datasetIndex]
                .data[tooltipItem.index];
    return label + "Reads Count : " + count;
   },
  },
 },
 plugins: {
  datalabels: {
   color: "white",
   formatter: (value, ctx) => {
    var perc = ((value * 100) / totalCount).toFixed(0) + "%";
    return perc;
   },
  },
 },
};
Next, consider a scenario where you are building a bar or line chart and need to explicitly designate what each axis represents, as illustrated here:
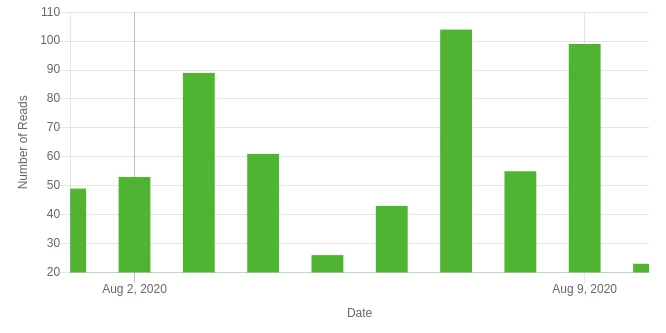
This requires adding the scaleLabel key to both the x and y axes, as shown in the snippet below:
ChartOptions: any = {
 responsive: true,
 scales: {
  yAxes: [
   {
    display: true,
    scaleLabel: {
     display: true,
     labelString: "Number of Reads",
    },
   },
  ],
  xAxes: [
   {
    scaleLabel: {
     display: true,
     labelString: "Date",
    },
   },
  ],
 },
};
Now, let's explore handling linear time-series data. Here, you might want to render all data points on the chart while only displaying a limited set of labels to avoid clutter. The full detail for each point becomes visible upon hovering. Furthermore, the labels should dynamically adapt as new data is added. In the chart below, the data interval is set to weeks, so the axis only presents labels for weekend dates.
This functionality is achieved by supplying your data as Date objects. The chart's options engine will then automatically preprocess and format the data appropriately.
ChartOptions: any = {
 responsive: true,
 showLine: true,
scales: {
  xAxes: [
   {
    barPercentage: 0.9,
    categoryPercentage: 0.55,
    type: "time",
    distribution: "linear",
    time: {
     unit: "week",
    },
    scaleLabel: {
     display: true,
     labelString: "Date",
    },
   },
  ],
  yAxes: [
   {
    scaleLabel: {
     display: true,
     labelString: "Number of Reads",
    },
   },
  ],
 },
};
Keep in mind that the type for the x-axis must be configured as time, and you must specify an appropriate unit for the time scale, such as day, week, or month.
These examples represent only a fraction of what chart.js offers. The library provides extensive control over aspects like axis minimum and maximum bounds, step size for data levels, gridline visibility, and numerous other settings. For a comprehensive collection of samples and an in-depth guide, refer to the official chart.js documentation.