
Every frontend developer relies heavily on the browser, whether it's for interactive tweaking, troubleshooting, performance tuning, or styling adjustments.
At some point, most of us have hit a wall trying to figure out how to debug a specific issue, analyze network traffic, or control the execution flow of our code. These challenges can eat up a surprising amount of time.
Here, I’m sharing some of the most effective tricks I’ve picked up for working with Chrome DevTools, focusing on practical shortcuts that make debugging much smoother.
Setting a Breakpoint on Attribute Modifications
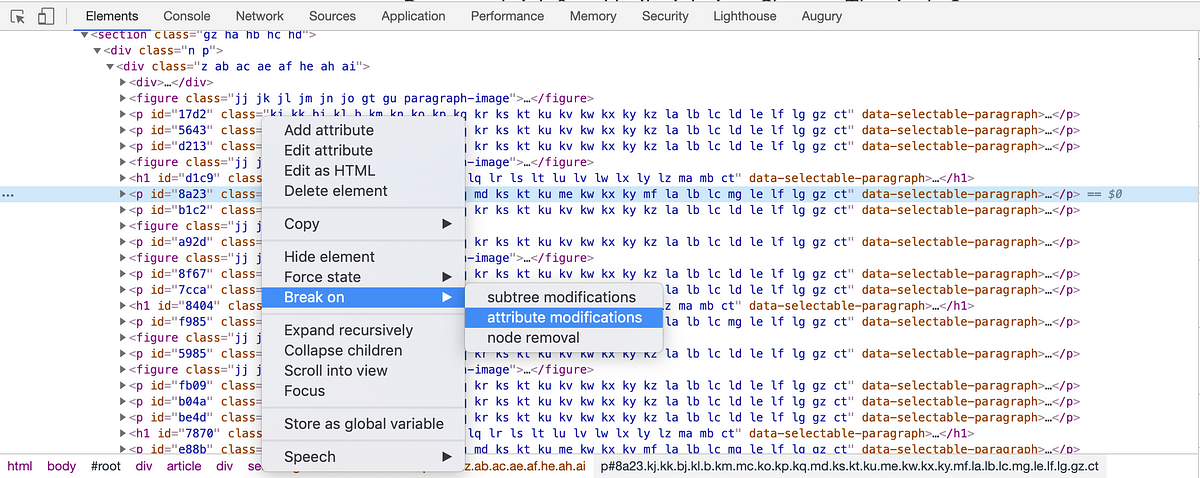
Sometimes you need to pause execution when a DOM element’s attributes are altered, especially when changes happen dynamically or under certain conditions.
In the Elements panel, simply right‑click the target element, then choose Break on → Attribute modification. You'll find additional breakpoint triggers here as well.
Using
monitor/unmonitor
The monitor function is perfect for tracking when a particular function gets invoked, whether it's called manually or through your application's workflow.
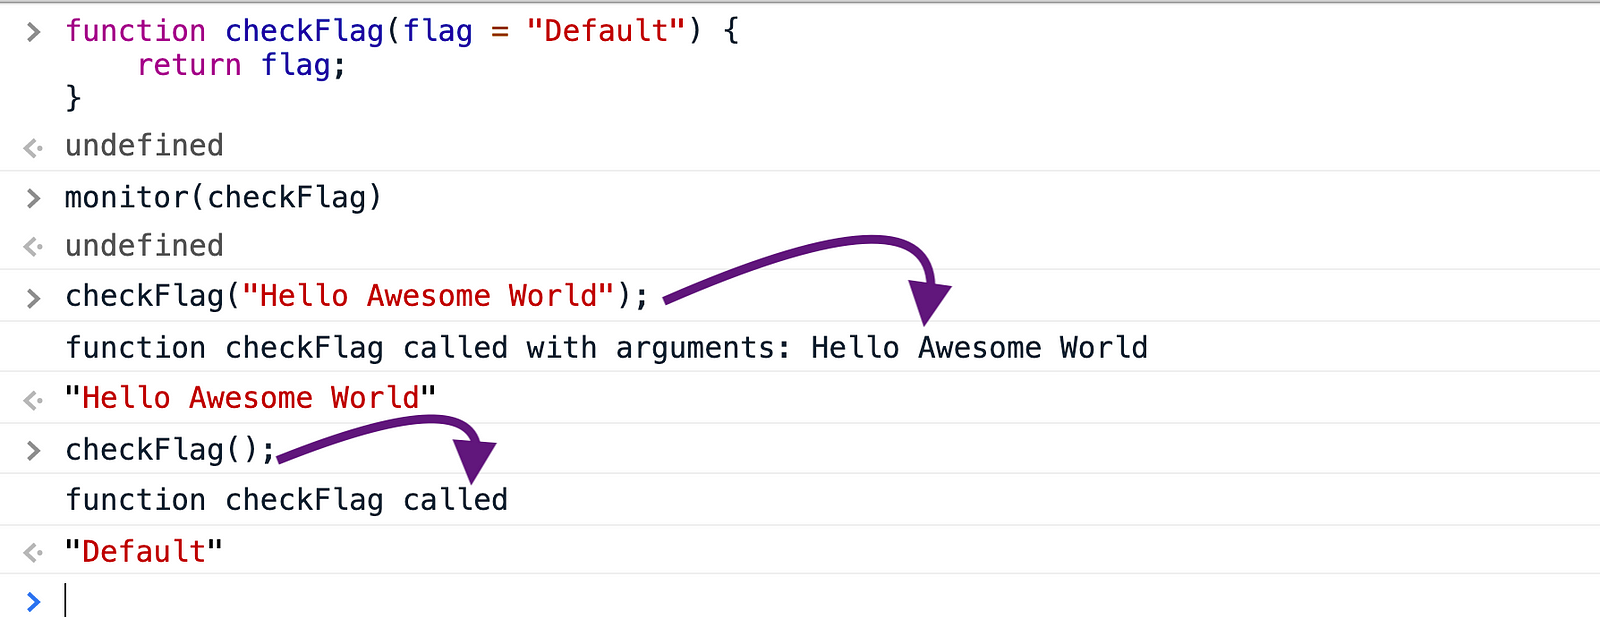
Check the line just below the arrow in the console.
In this example, we’re watching the checkFlag function. Every time it runs, the console logs an entry showing which parameters were passed.
Note: This tracking resets on page reload—you’ll need to re‑enable the monitor command if you want to keep logging.
To turn this off, use unmonitor and pass the function name, like so:
unmonitor(checkFlag)
Storing Complex JSON and Copying to Clipboard
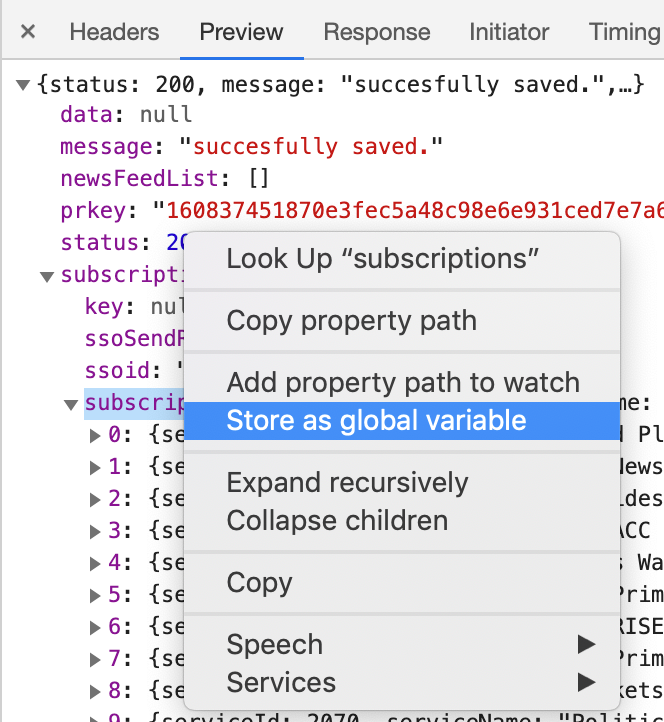
Right‑click and choose the highlighted option to save the data as a variable.
This trick is invaluable when you need to handle large payloads from API responses.
In the Preview tab, right‑click the response data and select Store as Global variable. DevTools creates a temporary variable, typically named temp1.
Then, use the copy(variableName) command in the console to transfer that data to your clipboard, ready for reuse.

Copy data to Clipboard with the copy command
Copying the Entire XHR Response
The Network tab allows you to filter requests by type, like XHR or Fetch. When you need the full response body, just right‑click the individual request and pick from the available copy options shown below.
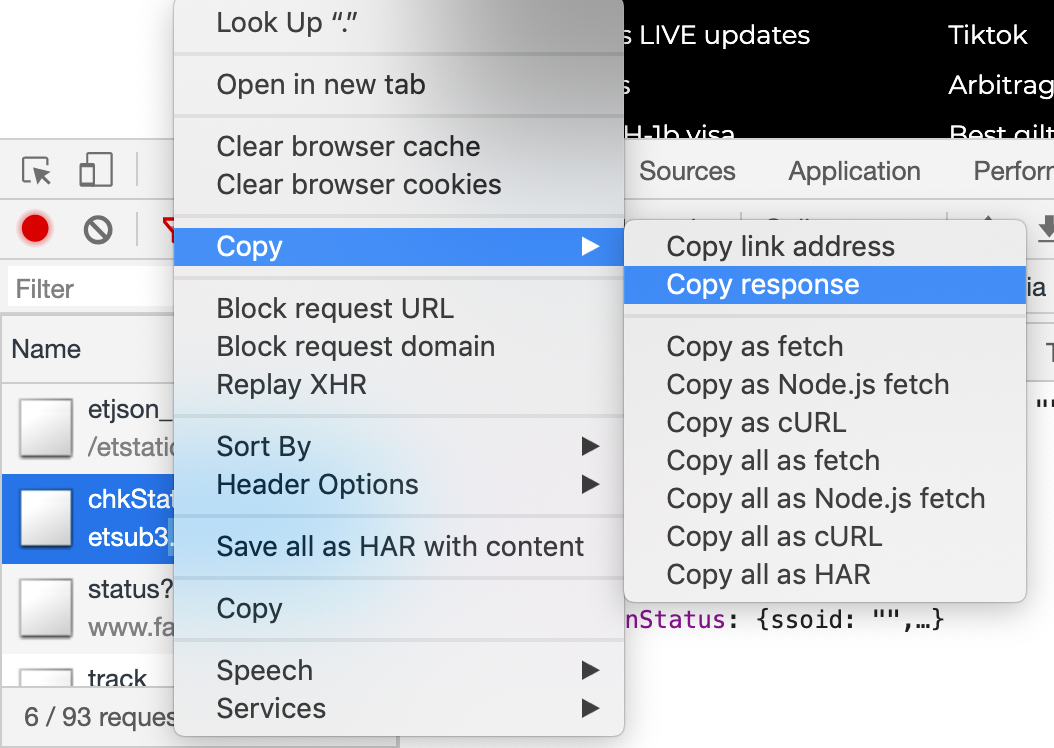
Network Tab context menu
Advanced Console Logging Techniques
Most developers default to console.log for output, regardless of whether it's a string, object, or array. But DevTools' console offers several other powerful methods to log data more effectively.
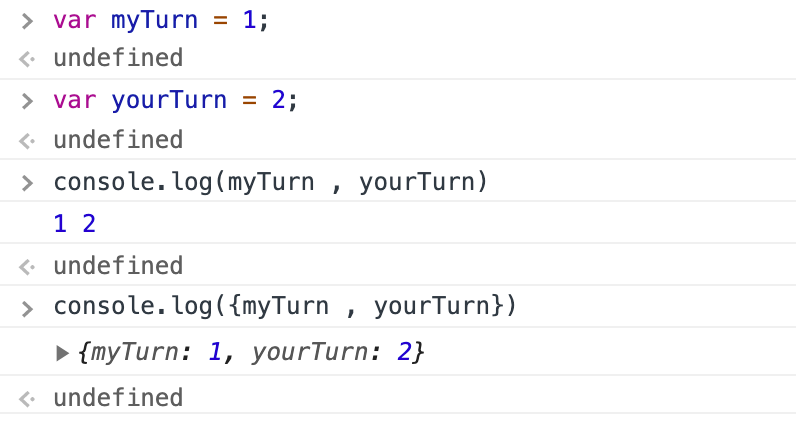
- Object‑style logging — rather than just logging a value, wrap it with the variable name so the console shows both the key and the value without extra effort.
console.table(Array)— displays array or object data in a clean, sortable table.console.clear()— wipes all existing console output instantly.console.count()— logs how many times a particular label or message has been repeated in the console. [Reference doc]console.error()— outputs messages in red, making it ideal for highlighting errors. There are alsoconsole.info()andconsole.warning()for different levels of feedback.
Preserving Logs
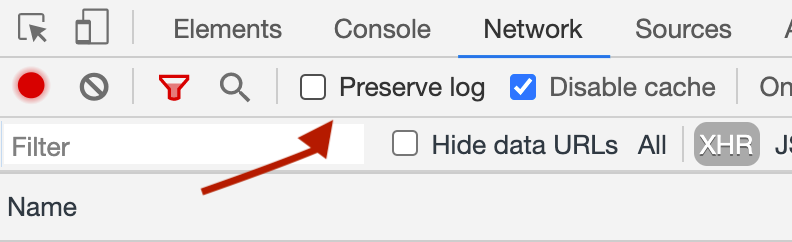
Toggle this setting when needed
This option is a lifesaver when debugging form submissions, page redirects, or API calls during navigation. With Preserve Log enabled, network requests stay visible even after a full page refresh—something that doesn't happen by default.
You can also keep console logs from being cleared. Click the gear icon in the Console panel and enable Preserve Log. See below, where this option lives:

Screenshot Tools — Nodal, Full Page, and More
There are plenty of times we need to capture just a portion of the screen, a single DOM node, the entire page, or even just the visible viewport. DevTools has four dedicated options for this, so give them a try.
Press CMD+P (mac) | Ctrl+Shift+P (Windows)

Keyboard shortcut for screenshot commands
Copying a Node Path
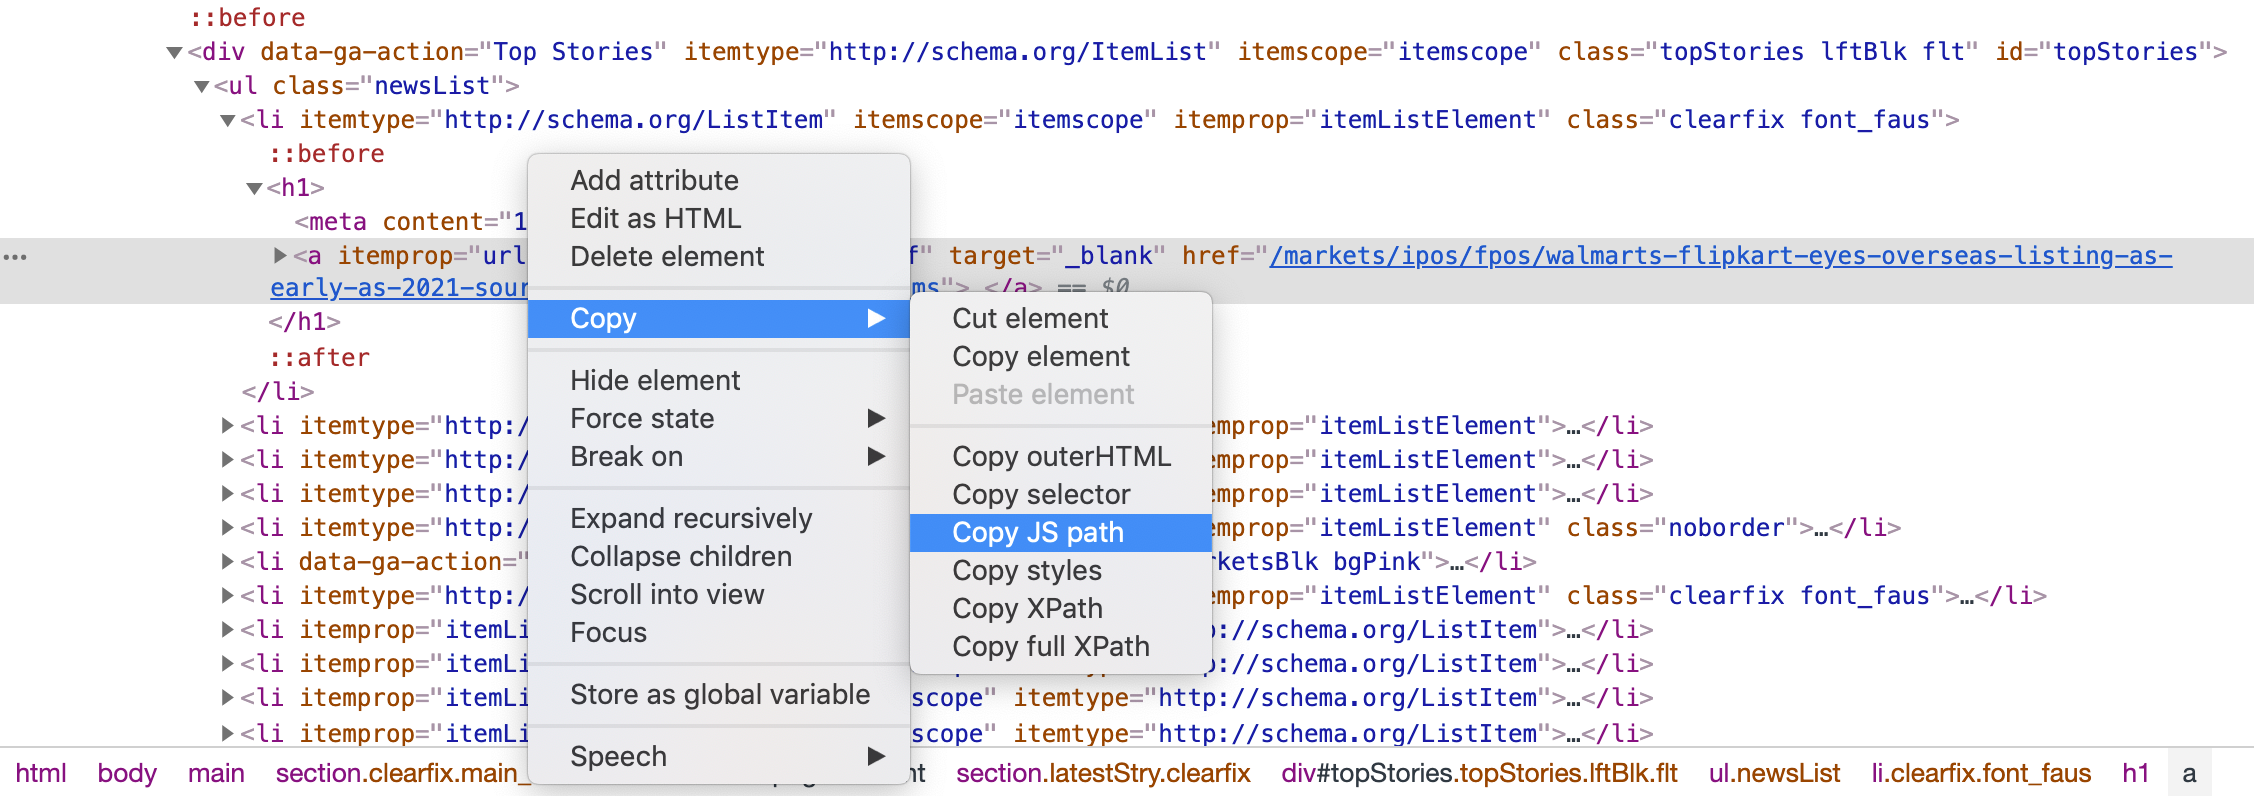
Finding and copying a precise JS path for an element can be tedious, but DevTools makes it effortless.
Right‑click the element → choose Copy → select Copy JS path.
Switching Dock Position via Shortcut
If you're like me and prefer using the keyboard over the mouse, you’ll appreciate the quick shortcut to change where DevTools are docked — right from the Sources panel.

Keyboard shortcut for dock position toggle
Zooming DevTools In and Out
Use Cmd+ and Cmd– on macOS or Ctrl+ and Ctrl– on Windows to adjust the zoom level of the DevTools window itself.
These are some of my favorite time‑saving DevTools tricks. If you have any hacks of your own, feel free to share them in the comments — I’m always happy to add new ones to this list.