Setting the stage
This is the first installment of a two-part series. Here, you'll explore the fundamentals of GitLab pipelines and construct an Angular pipeline that handles build, tests, coverage, and linting within a Docker setup. The follow-up article shifts focus to deployment, covering Docker image publication and GitLab Pages deployment.
If GitLab is unfamiliar territory, rest assured—this guide walks through each step. You'll find numerous links to thorough documentation alongside the explanations. Even if you rely on other CI/CD platforms, the underlying concepts and commands translate well.
Initial steps
We'll start with a standard Angular application scaffolded via ng-cli.
$ npm install --global @angular/cli
$ ng new my-app
Making the pipeline work requires minimal changes to your codebase. The core task is defining each pipeline stage inside the gitlab-ci.yml file.
Here's what the final pipeline looks like in action:
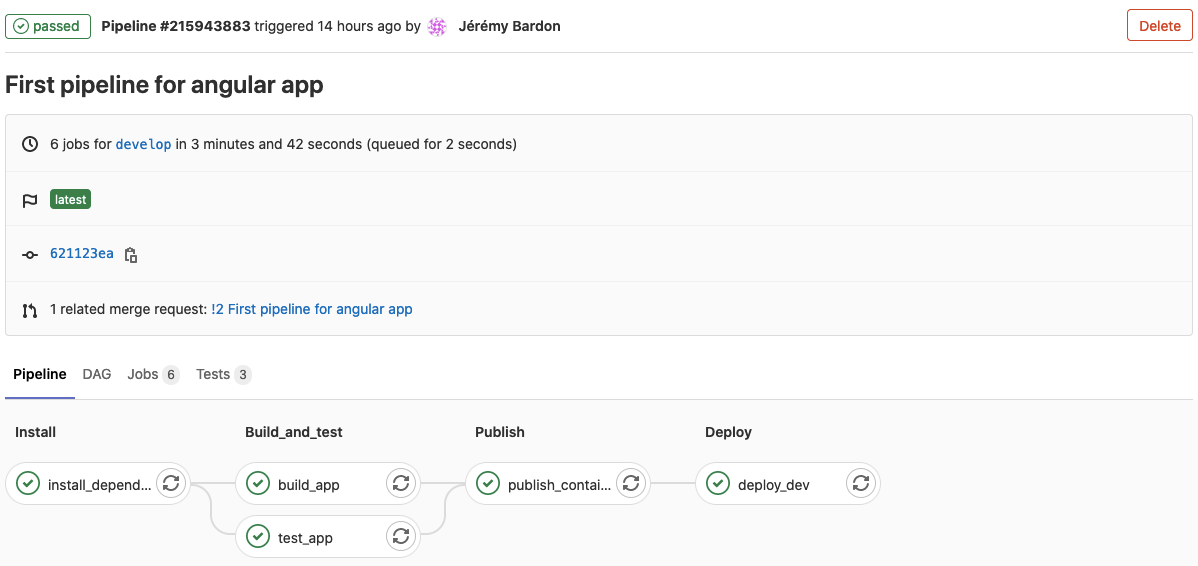
By the series' end, this is the GitLab pipeline you’ll have. For now, we’ll zero in on the three early stages. First, let’s get comfortable with some fundamental pipeline concepts—they’re quite similar to what you’d see in Jenkins, CircleCI, or TeamCity.
Understanding GitLab CI
A CI tool ensures your code builds and passes tests in a pristine environment, guaranteeing it functions on any machine or server—not just your own setup.
The approach involves executing tasks in a CI environment. Since many projects need task execution, multiple machines handle the workload. In GitLab terminology, we don't call them tasks or machines; instead, we have Jobs carried out by Runners.
By default, jobs execute sequentially. However, you can parallelize jobs by grouping them into stages.
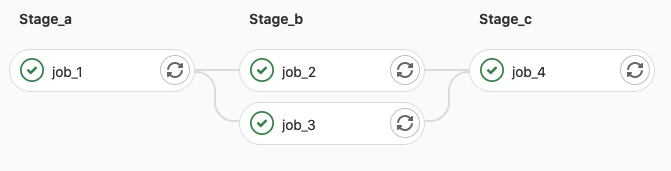
Pipeline with parallel jobs
Runners don't execute scripts directly. They hand off the work to executors, which come in various types like Docker, shell, and ssh.
Let’s try a simple job that runs node --version. To ensure nodejs is present, we’ll use the docker executor. This executor runs the command inside a container built from the node:12-alpine image.
job_1:
  stage: stage_a
  image: node:12-alpine
  tags:
    - docker
  script:
    - node --version
A job executing a node command
The image keyword specifies which Docker image to employ. However, the runner picking up your job must be configured with the Docker executor. You can target specific runners for a job via the tags keyword.

Output from the node command job running in a Docker container
A pipeline is the sum of all your defined jobs. Keep the ideas of jobs and runners in mind—they’ll make the upcoming sections clearer. For deeper details, check the GitLab CI/CD quick start guide.
Dependency installation job
Prior to building or testing, you must install project dependencies, typically via npm install. Isolating this in its own job is crucial because subsequent jobs rely on it—you don’t want to reinstall dependencies and waste time.
Every job runs on GitLab runners. With multiple runners, you must share job outputs (like the node_modules directory) across them. Either a cache or artifact can do this, but for this case, caching fits better.
stages:
  - install

install_dependencies:
  stage: install
  image: node:12-alpine
  tags:
    - docker
  script:
    - yarn install
    - yarn ngcc --properties es2015 --create-ivy-entry-points
  cache:
    key:
      files:
        - yarn.lock
    paths:
      - node_modules
  only:
    refs:
      - merge_requests
      - master
    changes:
      - yarn.lock
Dependency installation job
There’s an additional step after installing dependencies. For an Ivy-based project, you need to run the compatibility compilation for libraries that depend on Angular. Normally, this happens during ng build and ng test. In the pipeline, we execute it beforehand to finalize node_modules in one go. Note that running ngcc isn’t required if it’s already configured in the postinstall script.
Sharing the resulting node_modules with later jobs relies on the cache keyword. Two small efficiency tweaks are worth noting:
- the cache refreshes only when
yarn.lockgets modified - other jobs apply the pull policy to skip uploading the cache
cache:
  key:
    files:
      - yarn.lock
  paths:
    - node_modules
  policy: pull
Pipeline-wide default settings
Later jobs fetch node_modules from the cache, which remains accessible across pipelines and jobs. Verify that all runners can reach the cache location. With a corporate license, you might have both internal runners and GitLab shared runners—both must access the cache, and your company registry if that applies.
Adding only:changes to this job ensures it skips when yarn.lock is untouched. It must pair with only:refs to behave correctly in merge requests.
The cache key depends on this same file—meaning when the job runs without a matching cache, it starts fresh. If installation drags, the fallback cache key comes in handy. A fallback cache with most dependencies preloaded makes fetching new ones quick. There’s no test shown for this optimization—honestly, I’m uncertain it brings enough value.
Ensure this job executes on the first pipeline run, since build and test jobs depend on the cache. Two ways to guarantee this:
- Commit once before adding
only:changesto this job - Commit the
yarn.lockupdate alongside the job—this happens if you follow through since you’ll add test reporter dependencies later.
Prefer npm? The docs offer a concise example using npm ci. Swap yarn.lock for package-lock.json in the samples above.
Application build job
Beyond code checking, the pipeline must compile the project and emit a production-ready bundle. The ng build --prod command handles Angular builds.
We adjust the project setup to output the built app to artifacts/app. This isn’t enforced, but a dedicated folder simplifies gathering outputs when multiple jobs produce artifacts.
{
  "projects": {
    "angular-app-example": {
      "architect": {
        "build": {
          "builder": "@angular-devkit/build-angular:browser",
          "options": {
            "outputPath": "artifacts/app"
          }
        }
      }
    }
  }
}
angular.json
GitLab exposes numerous predefined environment variables about the project and pipeline context. They’re ready to use alongside the variables keyword—for instance, to set the artifact path.
variables:
  PROJECT_PATH: "$CI_PROJECT_DIR"
  APP_OUTPUT_PATH: "$CI_PROJECT_DIR/artifacts/app"

build_app:
  stage: build_and_test
  image: node:12-alpine
  tags:
    - docker
  script:
    - yarn ng build --prod
  after_script:
    - cp $PROJECT_PATH/Dockerfile $APP_OUTPUT_PATH
  artifacts:
    name: "angular-app-pipeline"
    paths:
      - $APP_OUTPUT_PATH
  cache:
    key:
      files:
        - yarn.lock
    paths:
      - node_modules
    policy: pull
Observe that the typical ng build is prefixed with yarn. This guarantees you’re using the project-specific ng-cli instead of a global install. In practice, adding commands as package.json scripts keeps things tidy and ensures the proper ng-cli version is used.
{
  "scripts": {
    "ng": "ng",
    "build": "ng build --prod"
  }
}
$ yarn build
Additional files need to be part of the artifact. In the upcoming piece, building the Docker image for your project requires a Dockerfile. The after_script keyword runs commands post-script.
A job generates just one artifact, though support for multiple might arrive later. Still, an artifact can bundle several directories if needed. Artifacts from a pipeline are shared with other jobs. You can download them from various UI spots as a zip.
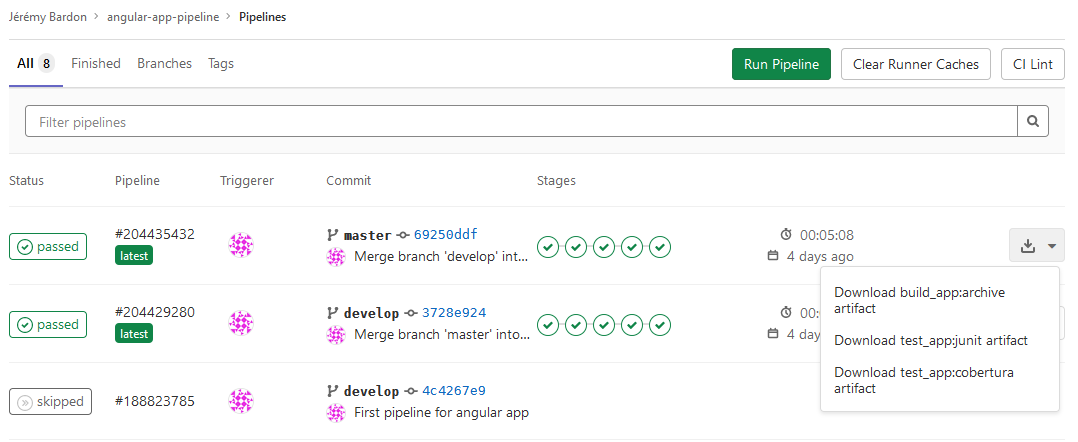
Pipeline artifacts
You might also use the artifacts:expire_in keyword to set an expiry. Large artifacts can clog runner storage. Default retention is 30 days, so pipeline artifacts stay up for a month.
Running tests in a dedicated job
The testing stage combines both unit tests and lint checks in one job. Whether these should be split is a point of debate, which we will address further down.
On top of knowing whether the job succeeded, we also want to capture unit test results and code coverage details. This data can be surfaced directly in GitLab merge requests. Starting with a minimal job definition, we'll refine it step by step.
variables:
  OUTPUT_PATH: "$CI_PROJECT_DIR/artifacts"

test_app:
  stage: build_and_test
  image: node:12-alpine
  tags:
    - docker
  before_script:
    - apk add chromium
    - export CHROME_BIN=/usr/bin/chromium-browser
  script:
    - yarn ng lint
    - yarn ng test --watch=false
Basic testing job
The --no-watch flag is present because watch mode is on by default, and you don't want the job hanging indefinitely waiting for file changes. Angular unit tests are executed by Karma, which relies on a Chrome browser instance. This means the container must come with Chromium pre-installed. The before_script section handles this, though it will run every time the job executes, adding roughly 30 seconds to the overall time. We'll look at optimizing this in the next installment.
The standard Karma setup won't function correctly on GitLab runners out of the box for two distinct reasons:
- There is no display monitor attached to a runner, so tests need to run on Headless Chrome
- Chrome will fail to start inside a docker container unless sandbox mode is turned off
Angular's default is to run tests in Chrome, but the browsers option allows you to override this behavior.
You can test this locally with the following command:
ng test --browsers=ChromeHeadless
We'll define a custom launcher in Karma to turn on headless mode while also disabling the sandbox.
module.exports = function (config) {
  config.set({
    customLaunchers: {
      GitlabHeadlessChrome: {
        base: 'ChromeHeadless',
        flags: ['--no-sandbox'],
      },
    },
  });
}
karma.conf.js
With this custom launcher defined, you can point to it via the browsers option in the CLI command: ng test --browsers=GitlabChromeHeadless.
Generating a JUnit test report
Test results are typically printed to the console. However, CI/CD systems need a structured report file containing this information to analyze it. Such a report format is supported by GitLab. This not only helps catch failures immediately after a merge but also shows the status directly in the merge request view.
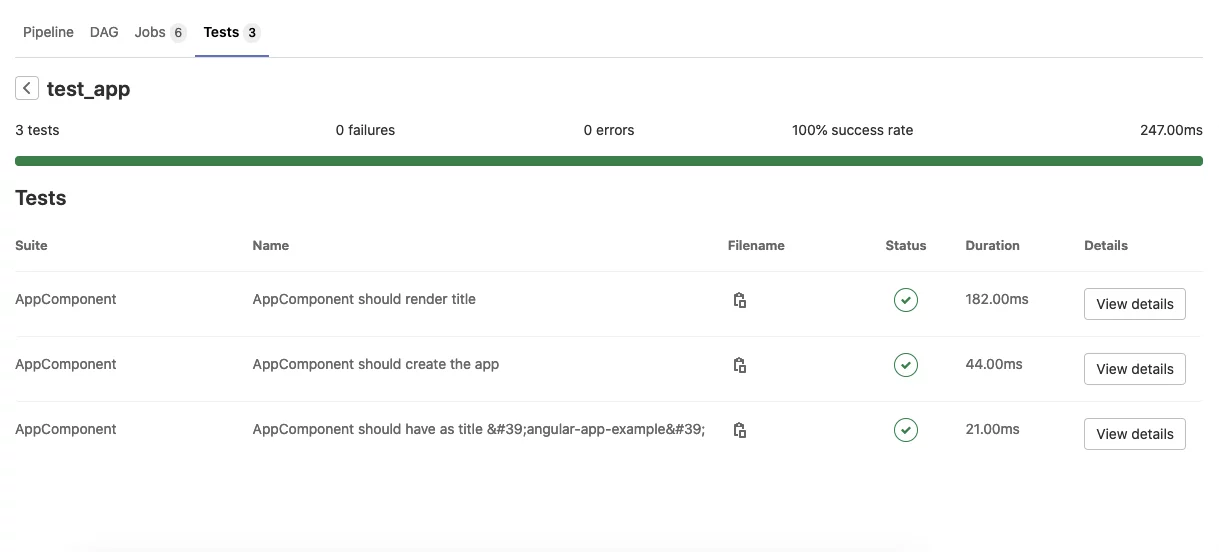
test_app job result details
The standard reporters in Karma don't generate a file that GitLab can parse. The sole compatible format for this purpose is the classic JUnit report. The next step is to integrate a reporter for it into your project.
$ npm install --save-dev karma-junit-reporter
module.exports = function (config) {
  config.set({
    plugins: [
      require('karma-junit-reporter')
    ],
    junitReporter: {
      outputDir: 'artifacts/tests',
      outputFile: 'junit-test-results.xml',
      useBrowserName: false,
    },
    reporters: ['progress', 'kjhtml', 'junit'],
  });
}
karma.conf.js
After this change, running the tests will yield a file at artifacts/tests/junit-test-results.xml. The final piece is to configure the job to expose this file so GitLab can process it.
variables:
  OUTPUT_PATH: "$CI_PROJECT_DIR/artifacts"

test_app:
  artifacts:
    name: "tests-and-coverage"
    reports:
      junit:
        - $OUTPUT_PATH/tests/junit-test-results.xml
Managing the coverage report
It might be a nice surprise that coverage data is generated for free during the test run. The --code-coverage flag passed to the test command activates the reporting mechanism. Angular uses Istanbul under the hood, which can generate various formats for the coverage report.
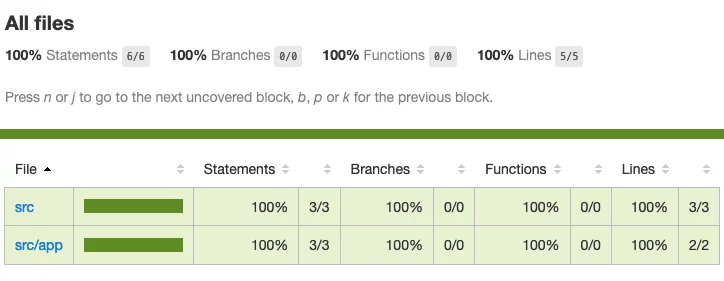
An example Istanbul html report
GitLab won't display a fully interactive coverage report inline. Nevertheless, it can provide aggregate coverage percentages for both the project and within merge requests.
However, among the formats Istanbul supports, only cobertura is natively understood by GitLab's visualizations. We need to adjust the Karma configuration here to output this format.
module.exports = function (config) {
  config.set({
    coverageIstanbulReporter: {
      dir: path.join(__dirname, './artifacts/coverage'),
      reports: ['html', 'lcovonly', 'text-summary', 'cobertura'],
      fixWebpackSourcePaths: true,
      'report-config': {
        'text-summary': {
          file: 'text-summary.txt'
        }
      },
    },
  });
}
karma.conf.js
Istanbul typically comes pre-configured in an Angular project's Karma setup. The key is to ensure both cobertura and text-summary are turned on. The first is consumed by GitLab for merge request views; the second is what gives you coverage totals for the overall project.
A test run with coverage flags will place reports into artifacts/coverage thanks to the configuration. This folder will contain the cobertura file, a text-summary file, and the standard html report output.
variables:
  OUTPUT_PATH: "$CI_PROJECT_DIR/artifacts"

test_app:
  coverage: '/Statements\s+:\s\d+.\d+%/'
  artifacts:
    name: "tests-and-coverage"
    reports:
      cobertura:
        - $OUTPUT_PATH/coverage/cobertura-coverage.xml
The previous JUnit report was exposed as an artifact, and this is the exact same approach for the coverage report. Once in place, GitLab will show red and green highlights on the lines of your new code in a merge request, illustrating which sections were covered by tests.
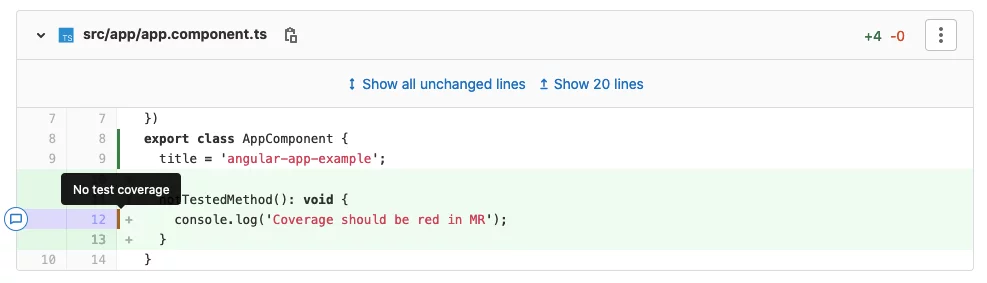
Line coverage in a merge request
When text-summary is enabled, a console output shows the project-wide coverage percentage. GitLab can parse this output if you provide the coverage keyword in your job definition along with a regex to match the text.


Coverage totals visible in the console and the merge request
If this metric isn't easy to see, the same info is stored in artifacts/coverage/text-summary.txt. A simple cat command in your script will display the file's content on the console manually.
For scenarios requiring a headline number for multiple coverage types, the coverage-average package can calculate an average value. You can also produce a comprehensive metrics report, which is a premium feature that appears in merge requests for those requiring more granular detail.
Project coverage isn't limited to merge requests. For those interested in project badges, there's a specific badge designed for this metric.
Final thoughts on the test job
You might have noticed that the lint check is folded into the test job rather than being a standalone stage. This is a deliberate choice driven by two main factors:
- Splitting the lint would require a separate runner to pick up that new job. Depending on the capacity and availability of your runner pool, this can be a limiting factor.
- Having lint run in parallel immediately means the pipeline waits for the slower test job to finish, even if lint fails quickly, which could result in a wasted test run.
In this example, the consolidated job runs lint before unit tests. However, this also means the test job takes ~8 seconds longer than a pure unit test job, and there is a possibility of the job failing on lint without the unit tests executing at all.
variables:
  OUTPUT_PATH: "$CI_PROJECT_DIR/artifacts"

test_app:
  stage: build_and_test
  image: node:12-alpine
  tags:
    - docker
  before_script:
    - apk add chromium
    - export CHROME_BIN=/usr/bin/chromium-browser
  script:
    - yarn ng lint
    - yarn ng test --code-coverage --watch=false --browsers=GitlabHeadlessChrome
  coverage: '/Statements\s+:\s\d+.\d+%/'
  artifacts:
    name: "tests-and-coverage"
    reports:
      junit:
        - $OUTPUT_PATH/tests/junit-test-results.xml
      cobertura:
        - $OUTPUT_PATH/coverage/cobertura-coverage.xml
  cache:
    key:
      files:
        - yarn.lock
    paths:
      - node_modules
    policy: pull
The full test job implementation
In the final pipeline design, the test job and the build job are placed in the same stage so they run concurrently. They are independent because both solely require node_modules, and their runtimes are also similar, making the parallel execution an efficient choice.
When jobs coexist in a stage but have no need for each other’s outputs, be sure to clear any default artifact downloading. Set the dependencies property to an empty list to explicitly prevent this.
Summary
By now, you should be confident in the fundamentals of GitLab CI: working with jobs, runners, and their directives. The example project in this article has a fully functional pipeline with three jobs dedicated to installing dependencies, building the app, and running tests.

Final pipeline for an Angular app (part 1)
The reporting integration is complete; test outcomes and coverage percentages appear within the merge request UI. Remember that our E2E runs are absent, but the library-focused jobs share the same structure, only requiring you to nest the npm scripts (i.e., ng test library-name).
You can run this setup yourself by looking at the angular-app-pipeline live project on GitLab.
If you need to validate the syntax of your pipeline file, CI Lint is the right place to do so. The journey doesn't end here. You can see how to roll out deployment jobs for Angular applications and libraries in the second article. I look forward to hearing your thoughts in the comments.
Thanks for reading!