Streamlining Angular Ivy Debugging with a Chrome Extension
When operating outside of production mode, the Angular Ivy runtime exposes a collection of helper functions on the global ng object. These utilities let developers both inspect and alter the current application state directly from the browser console. While powerful, this approach demands a fair amount of manual effort to be practical.
To address this friction, we built SB Angular Inspector, a dedicated Chrome extension that wraps these debugging capabilities in a more accessible interface.
For this demonstration, we’re using the freely available, open-source SB Clean Blog Angular project, run locally in development mode.
Start by opening DevTools, moving to the Elements tab, and picking the sb-clean-blog-header element. Then switch to the SB Angular panel located on the right side of the inspector.
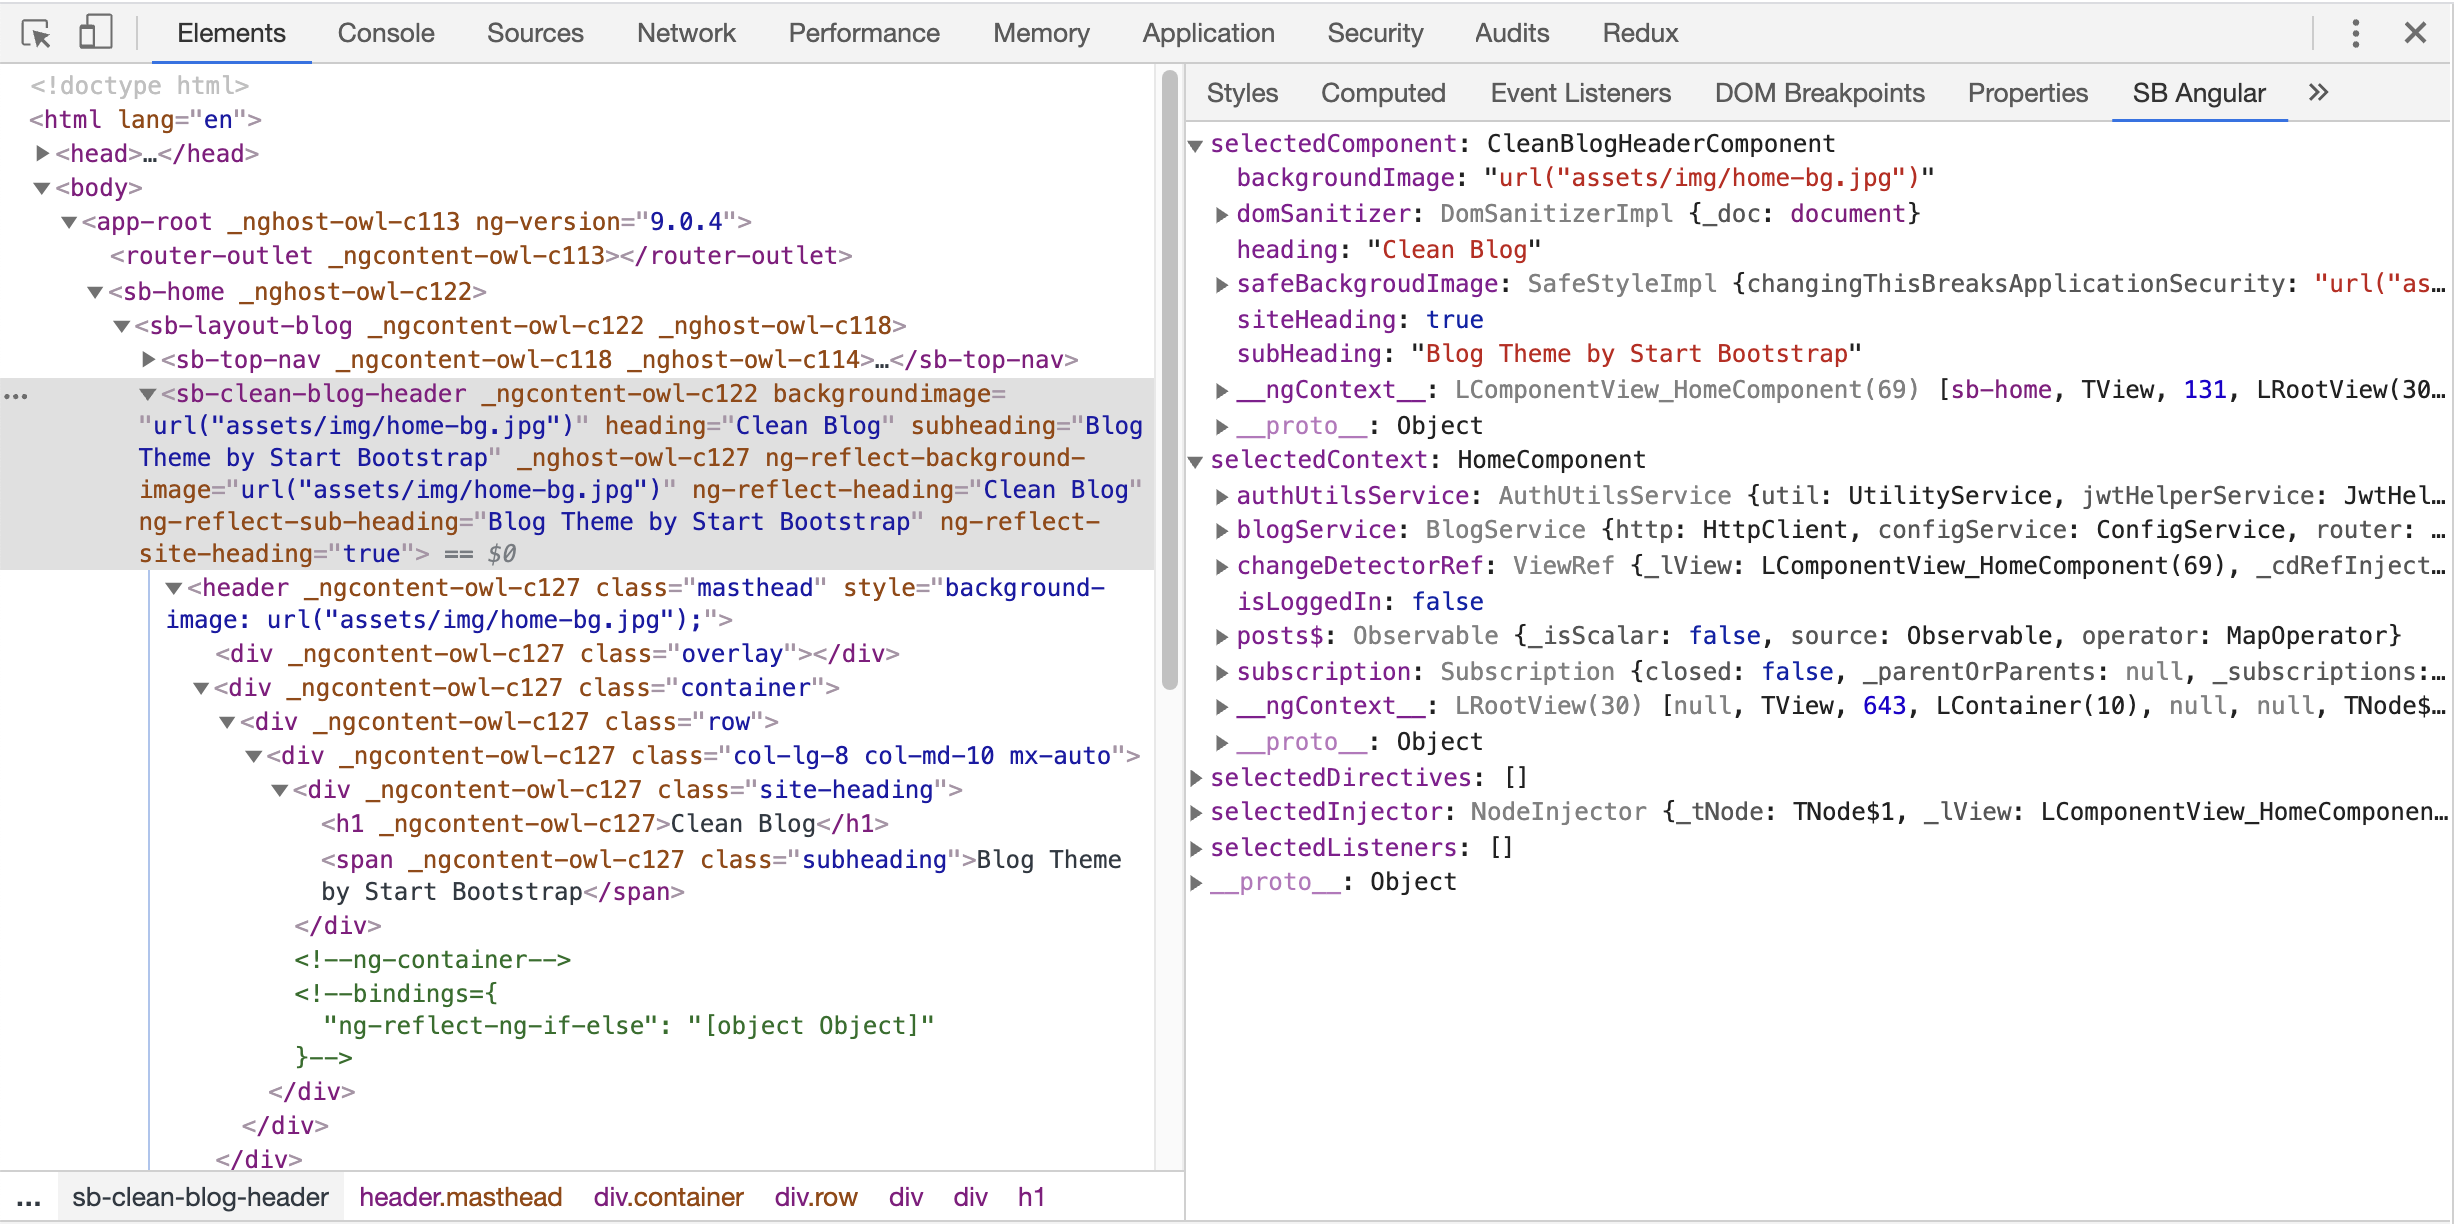
Immediately, the current properties of our targeted component, CleanBlogHeaderComponent, appear alongside the active context HomeComponent and its own fields. If the element hosted any directives, they would all be listed under selectedDirectives as well. For deeper investigations, we also surface selectedInjector and selectedListeners, though typical debugging rarely requires them.
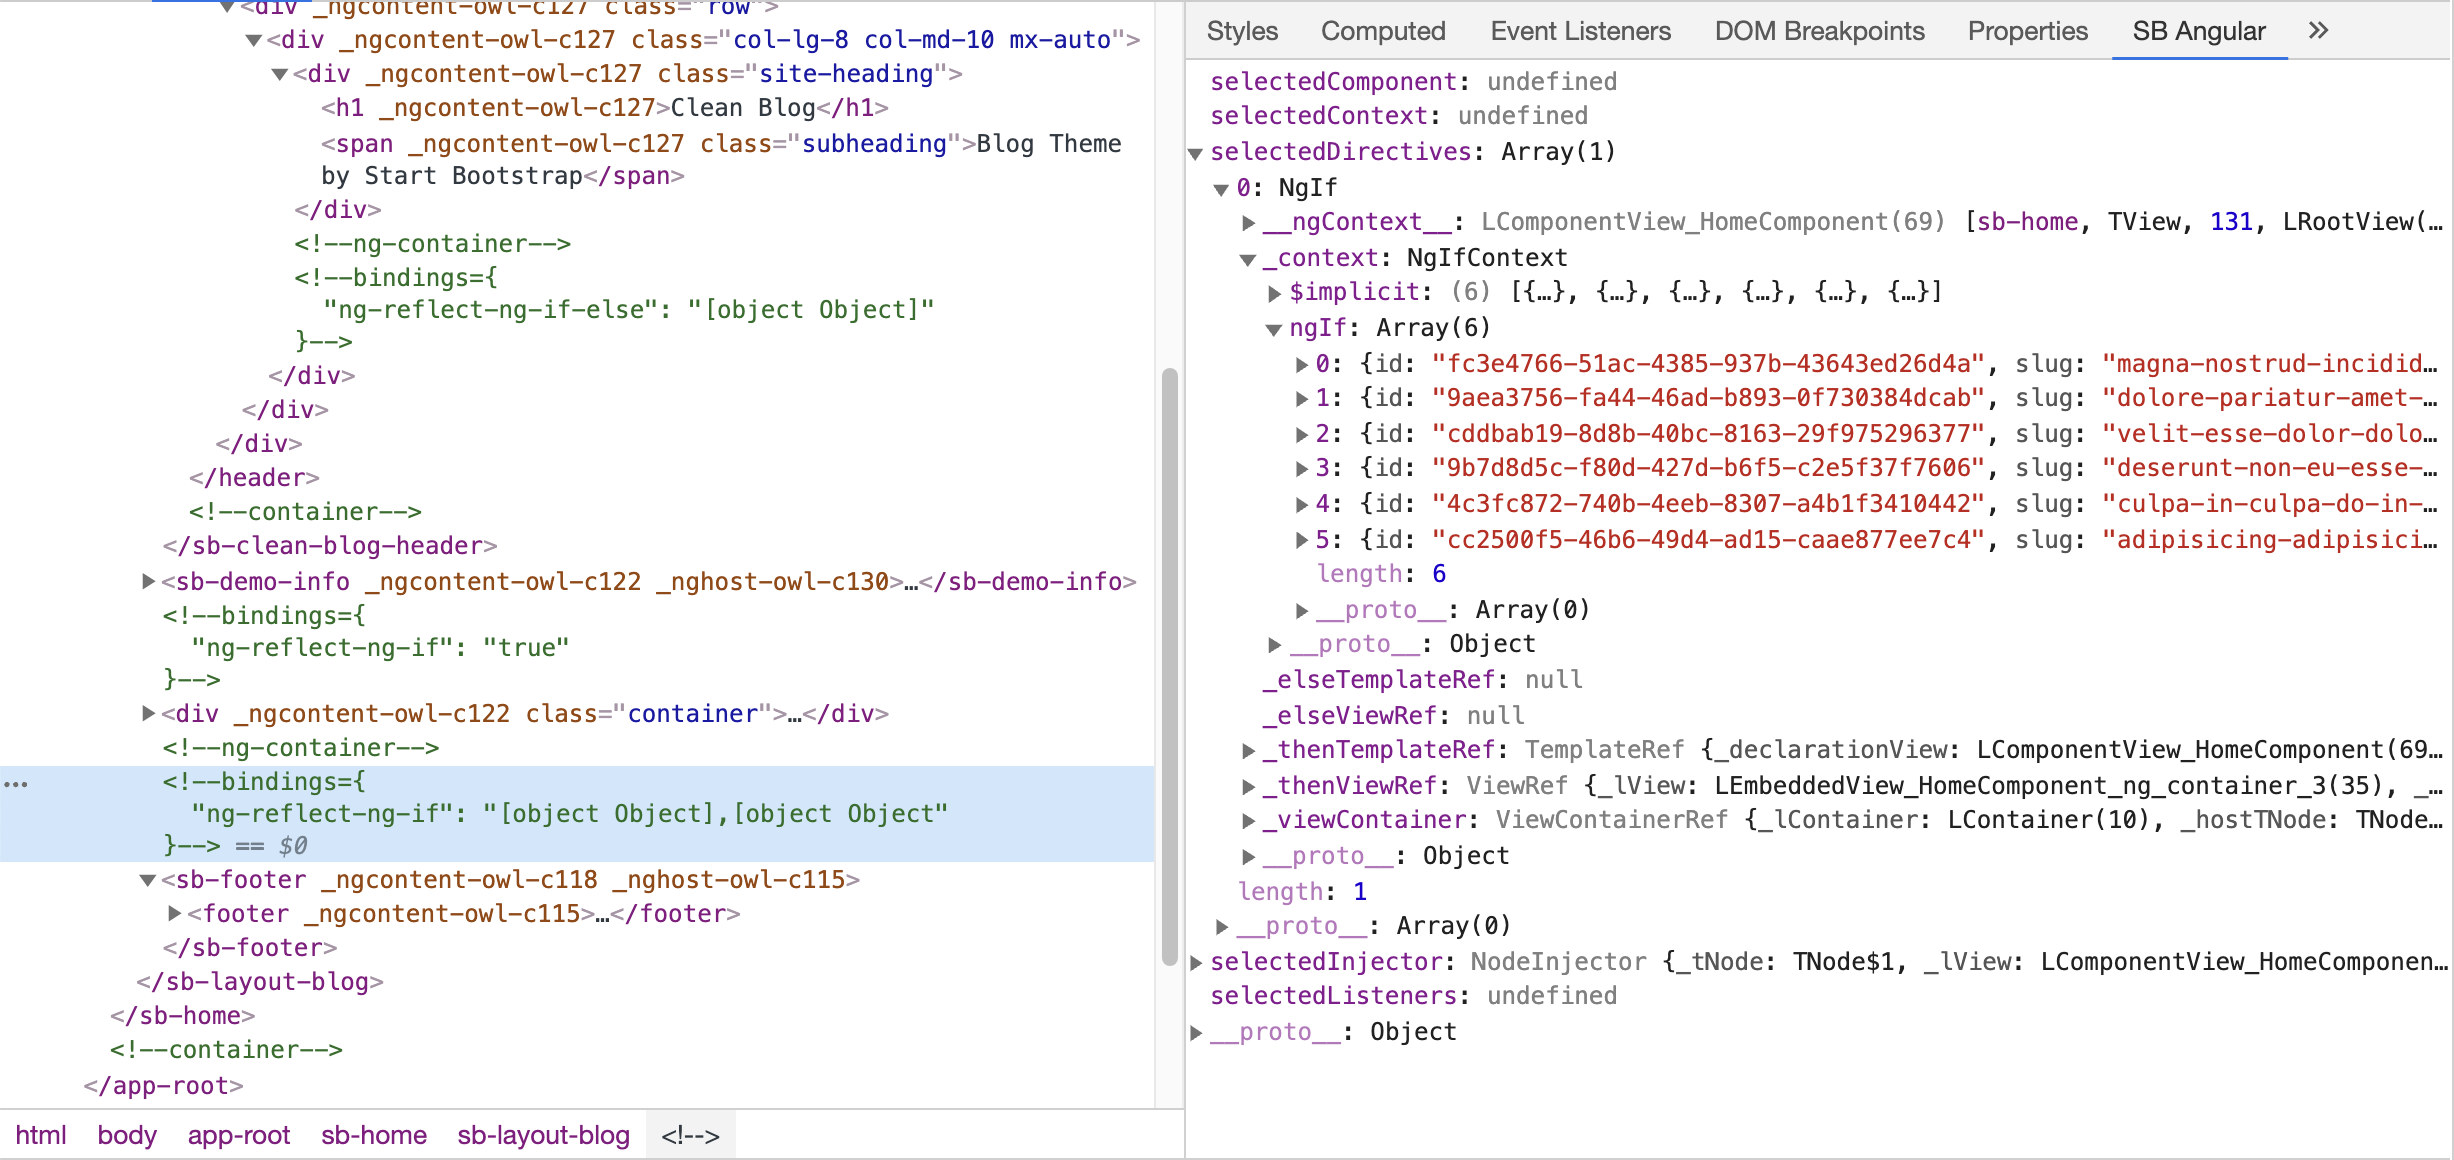
The selectedContext field proves especially handy when diagnosing unexpected behavior in your templates — such as a stubborn *ngIf that refuses to cooperate. By selecting the <!--bindings comment node, you can examine the underlying NgIf directive’s context directly. In our blog project, an *ngIf guards the rendering of the blog post list until the array is populated.
Here’s how you can confirm this with the inspector:
Perhaps the most valuable feature is the ability to edit and commit real-time changes to your component’s state during debugging. In our example, CleanBlogHeaderComponent serves double duty — it renders both the home page banner and the post headers, toggling styles based on the siteHeading boolean. Let’s flip that value to see the visual difference.
First, change the value from true to false in the extension’s panel:
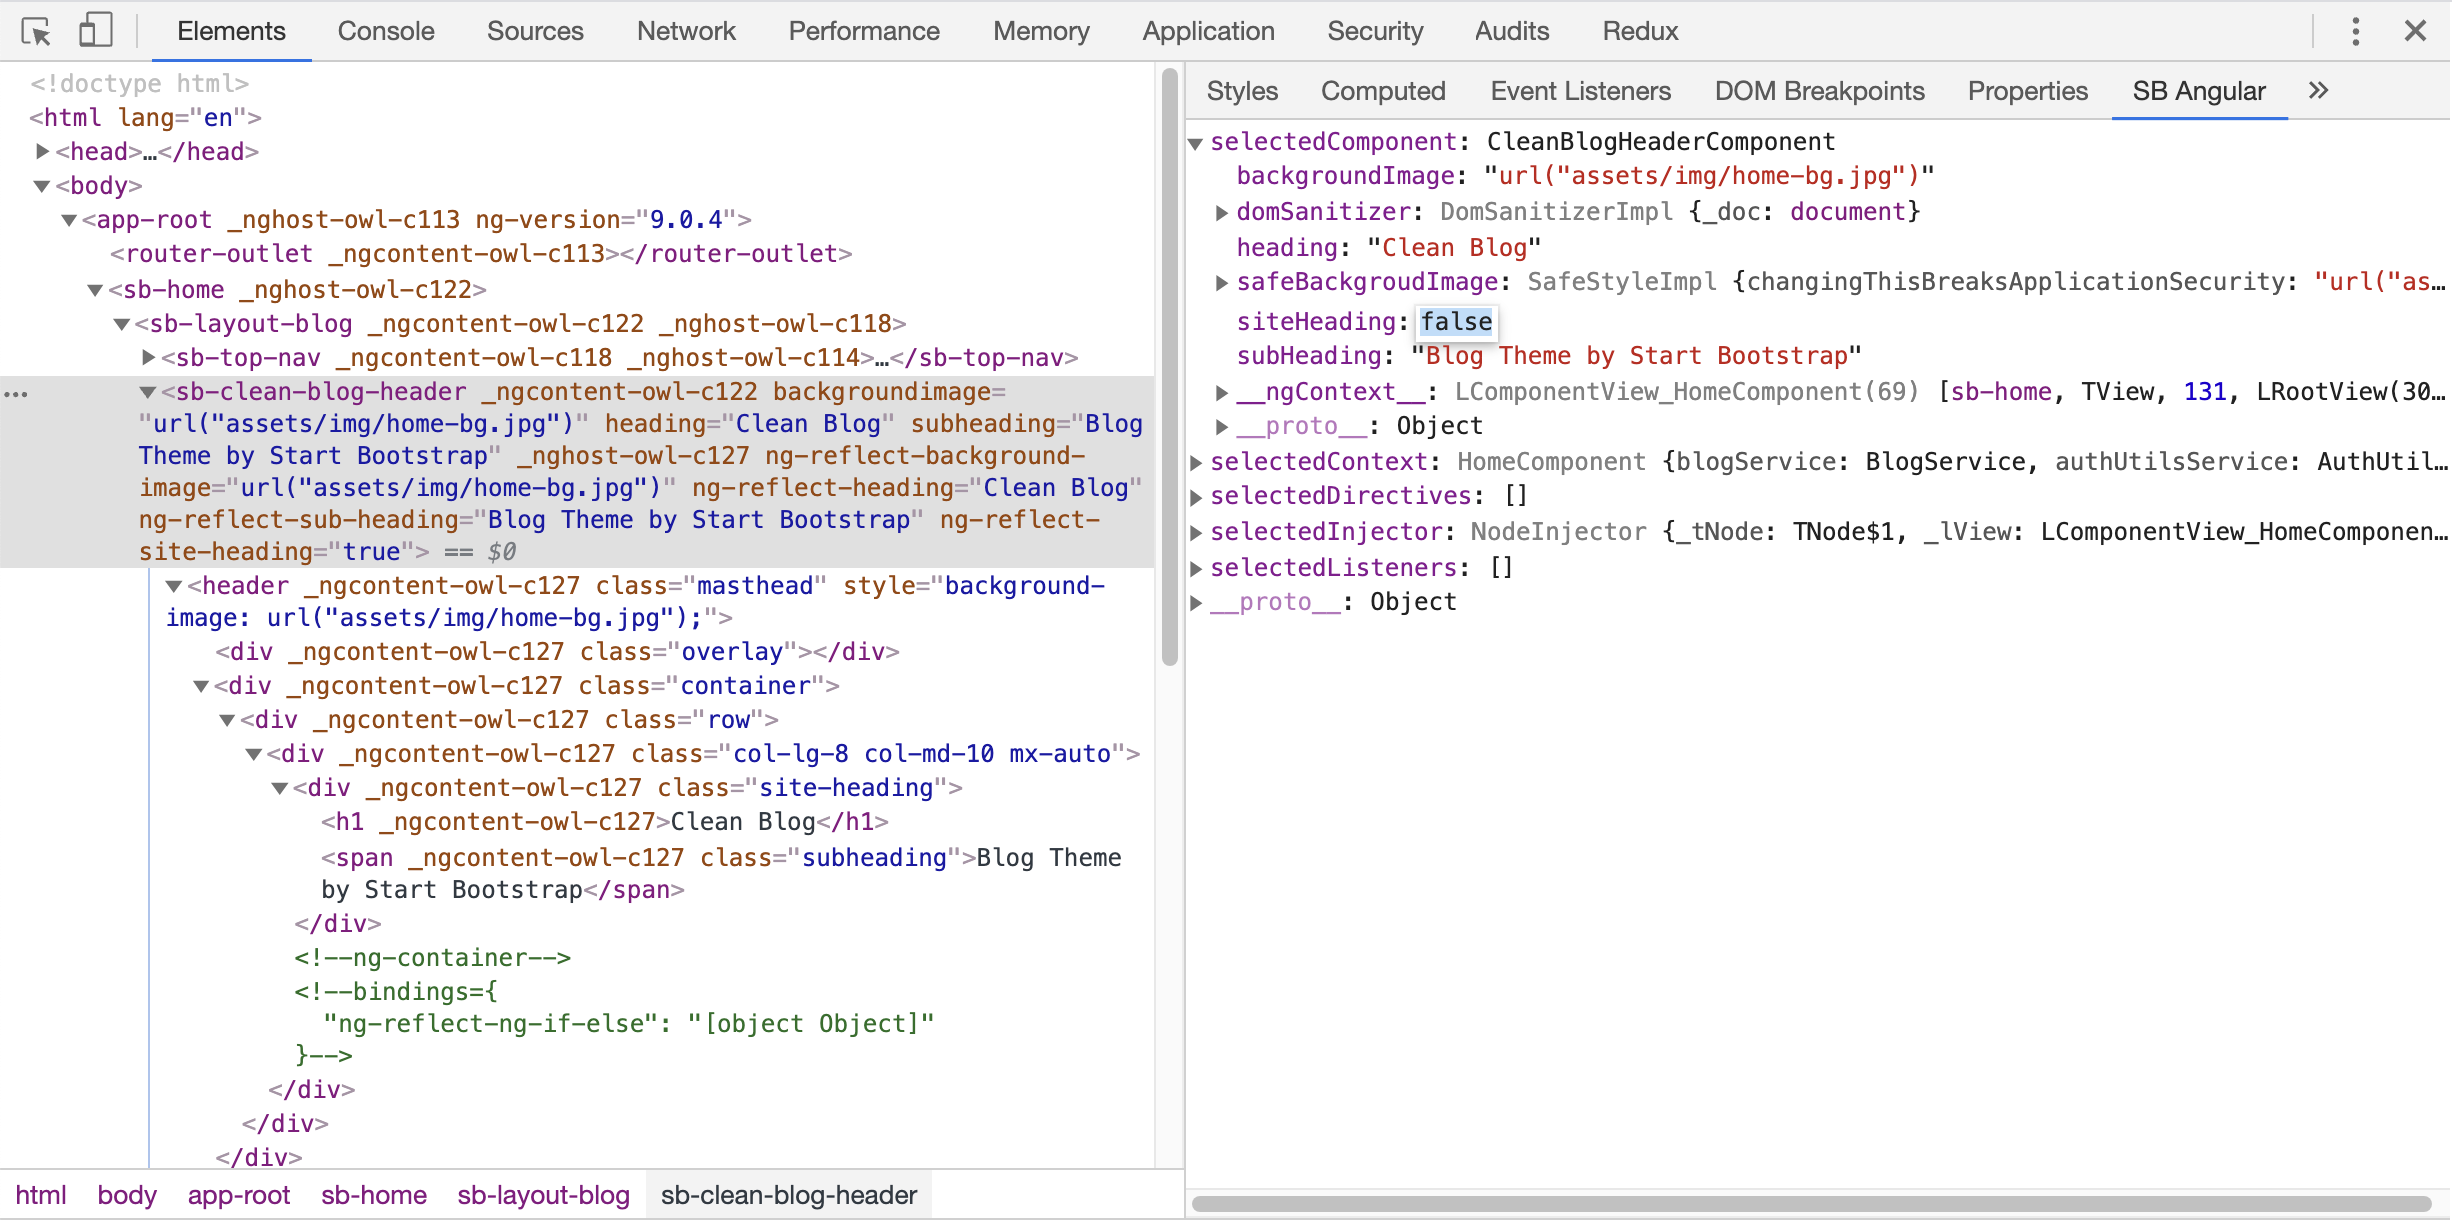
Next, click the SB Angular Inspector icon in the toolbar and hit „Apply Changes”:
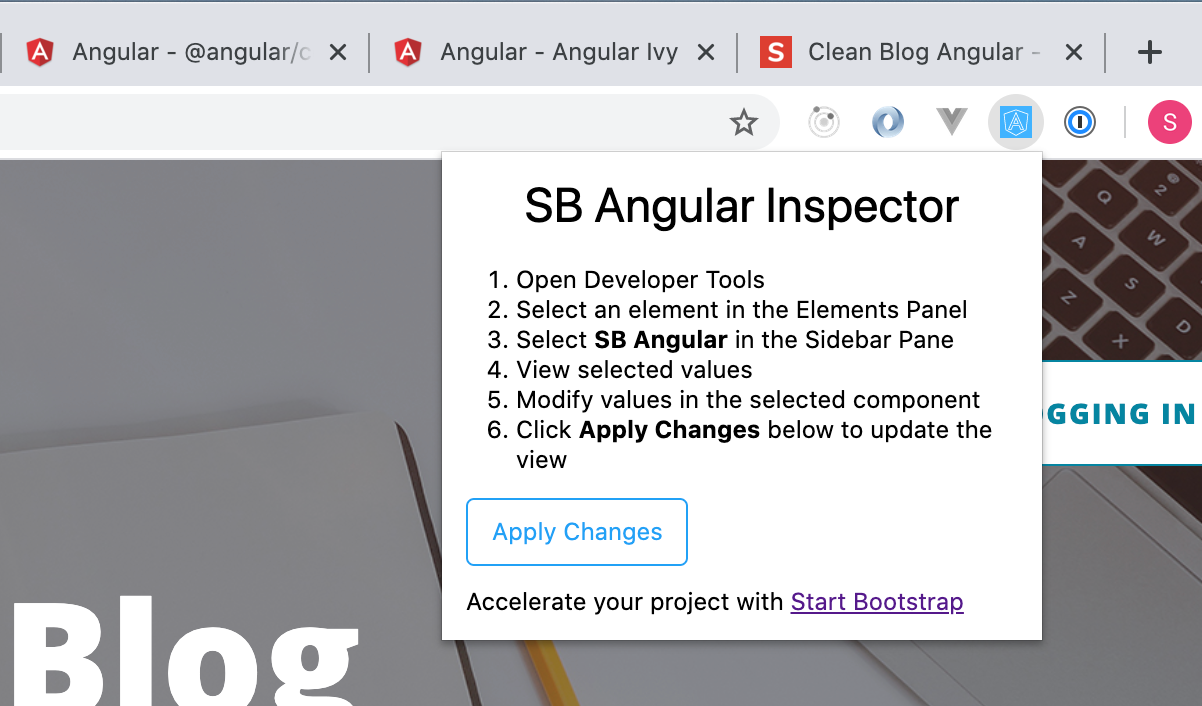
The update should take effect instantly.
Before:

After:

Getting comfortable with inspecting and mutating application state is a key step in mastering any framework or language. We’re hopeful this extension makes that process smoother. Happy debugging!