
Getting started with a basic Initial Load test
An easy first step is to open the network tab in Chrome or Chromium Dev Tools.
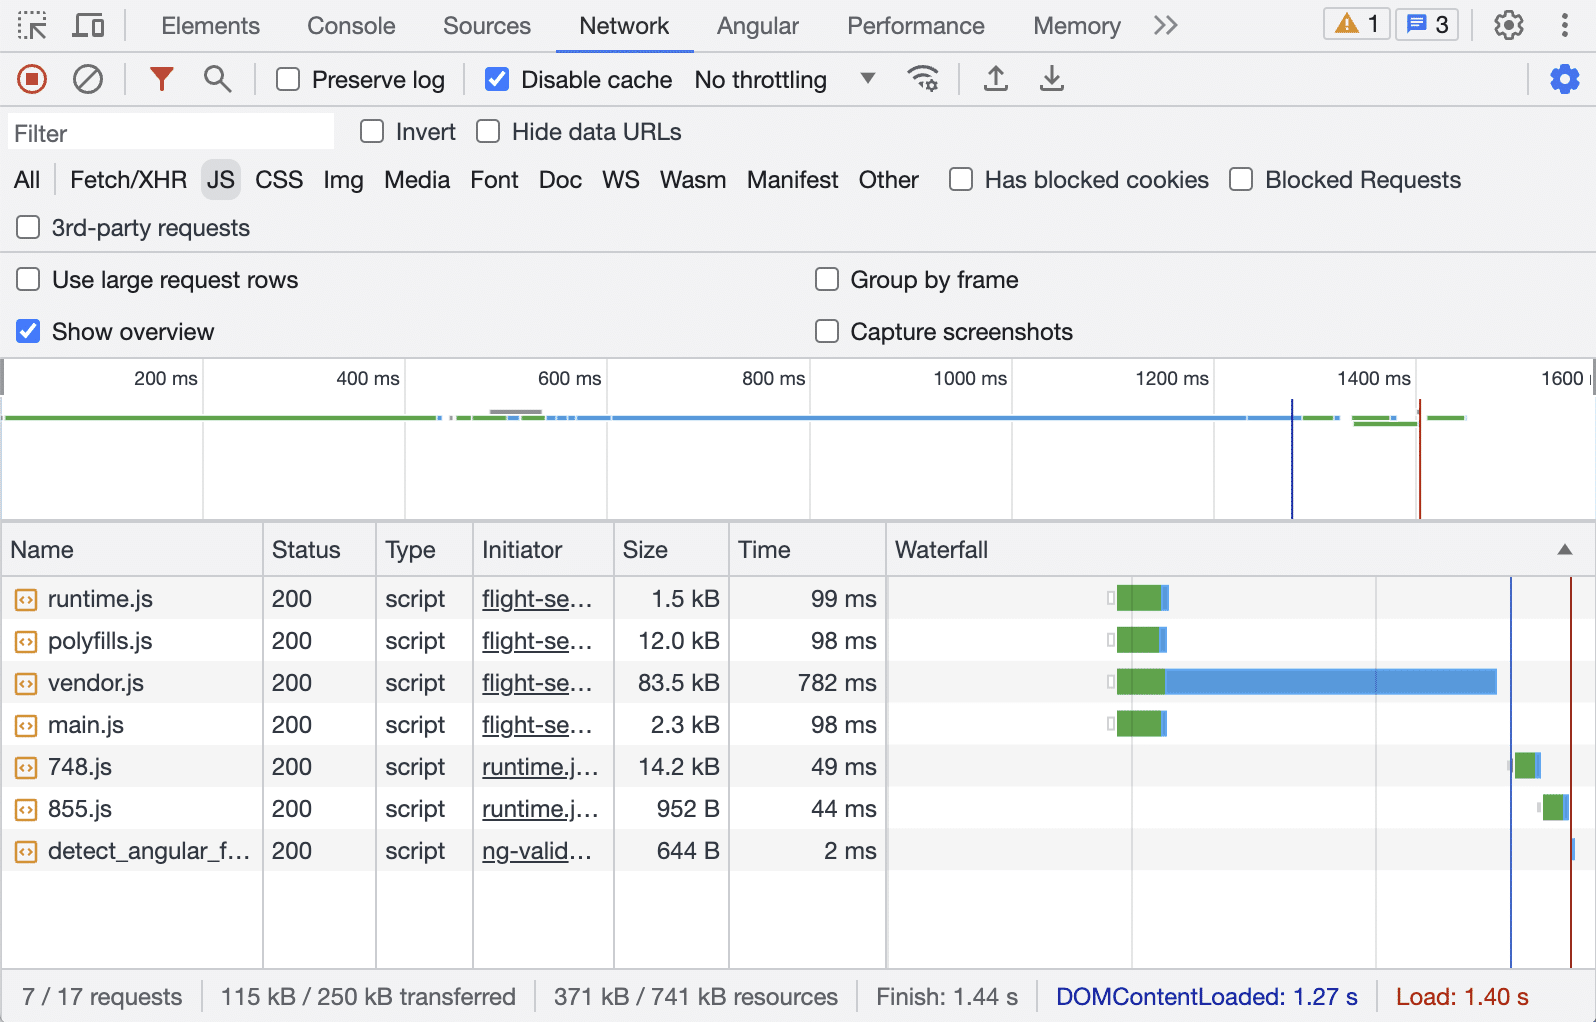
Illustration: Google Chrome Dev Tools network tab
In this view, three key measurements stand out:
- DOMContentLoaded (blue vertical line): Fires when the initial HTML document is fully downloaded and parsed.
- Load (red vertical line): Fires when the page is fully loaded — meaning the HTML (1) plus all BLOCKING resources such as CSS and JS have been fetched and processed.
- Finish: Loading is considered complete when (1) and (2) are done, and additionally all NON-BLOCKING JS resources, XMLHttpRequests, and Promises have finished.
For more detailed insight, dedicated tools like Google Lighthouse, Google PageSpeed, or Webpagetest.org offer richer measurements. Below is an overview of common metrics used to evaluate Initial Load Performance:
Key metrics for Initial Load Performance
In my view, the most important evaluation is always a manual one — a developer actually looking at the app. It's essential to confirm that everything works as expected and that there are no errors, either visually or in the browser's Dev Console. This hands-on check ensures the site behaves correctly and delivers a smooth user experience.
Beyond that, an E2E Testing setup with Cypress or Playwright can help prevent performance measurements from being run on broken applications.
Once that baseline is in place, I recommend starting to track the following metrics:
- First Contentful Paint (FCP): FCP is a user-focused metric that measures perceived load speed by marking the first moment the user sees any content on screen. A fast FCP reassures the user that something is happening.
- Largest Contentful Paint (LCP): LCP is a stable Core Web Vital that tracks when the main content of the page has likely loaded. A fast LCP signals to the user that the page is useful.
- Total Blocking Time (TBT): TBT measures how long a page remains non-interactive before becoming reliably usable. A low TBT indicates the page is ready for interaction sooner.
- Cumulative Layout Shift (CLS): CLS is a stable Core Web Vital that quantifies unexpected layout shifts. A low CLS contributes to a more pleasant and stable user experience.
- Speed Index (SI): Introduced by Webpagetest.org, SI is a long-standing metric that calculates the average time at which visible parts of the page appear. It can also be influenced by viewport dimensions.
This list is by no means exhaustive, but by exploring these metrics, Angular developers can gain meaningful insights into their app's Initial Load Performance. That knowledge helps identify optimization targets, prioritize improvements, and ultimately enhance the overall user experience (as discussed in part I).
Tools for measuring Initial Load Performance
These tools don't just deliver a performance score — they also provide actionable recommendations for improvement. They can assist with optimizing CSS, JavaScript, images, and server configuration. Here’s my TOP 3 selection of the most useful tools:
- Google Chrome Lighthouse extension: After installing the Lighthouse extension, you can audit any web page — including localhost or pages behind a login — for performance, accessibility, SEO, and best practices. Like PageSpeed (which is built on Lighthouse), it provides scores and recommendations to improve load times, accessibility, and standards compliance.
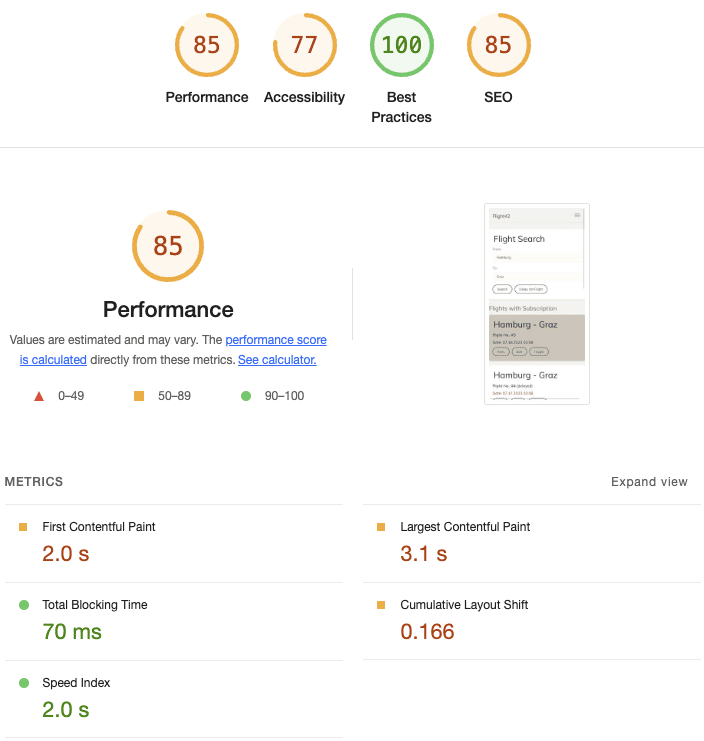
Illustration: Google Chrome Lighthouse extension
A note on the Performance Score (ranging from 0 to 100): Various key metrics factor into the score (see details). The threshold for achieving a high score has become more demanding over time — a score of 100 five years ago might only earn a 50 today, even with the same performance levels.
When evaluating an Angular app, it's wise to be a bit forgiving with the raw score. Here’s the rating scale I personally apply (entirely subjective):
- 0 - 20 Very poor — you might want to reconsider your approach
- 20 - 40 Poor — definitely needs work
- 40 - 55 Average — could be better
- 55 - 70 Good — still room to grow
- 70 - 80 Very good — maybe one or two tweaks
- 80 - 90 Excellent — nicely done
- 90 - 100 Impressive — probably too good to be true
- Google PageSpeed Insights: This free Google tool evaluates the performance of publicly accessible web pages. It generates an overall score and tracks all the metrics listed above. PageSpeed presents two distinct outcomes: one based on real-world data collected from actual users (if your app has sufficient traffic), and another from a lab test run via Google Lighthouse on Google's infrastructure.
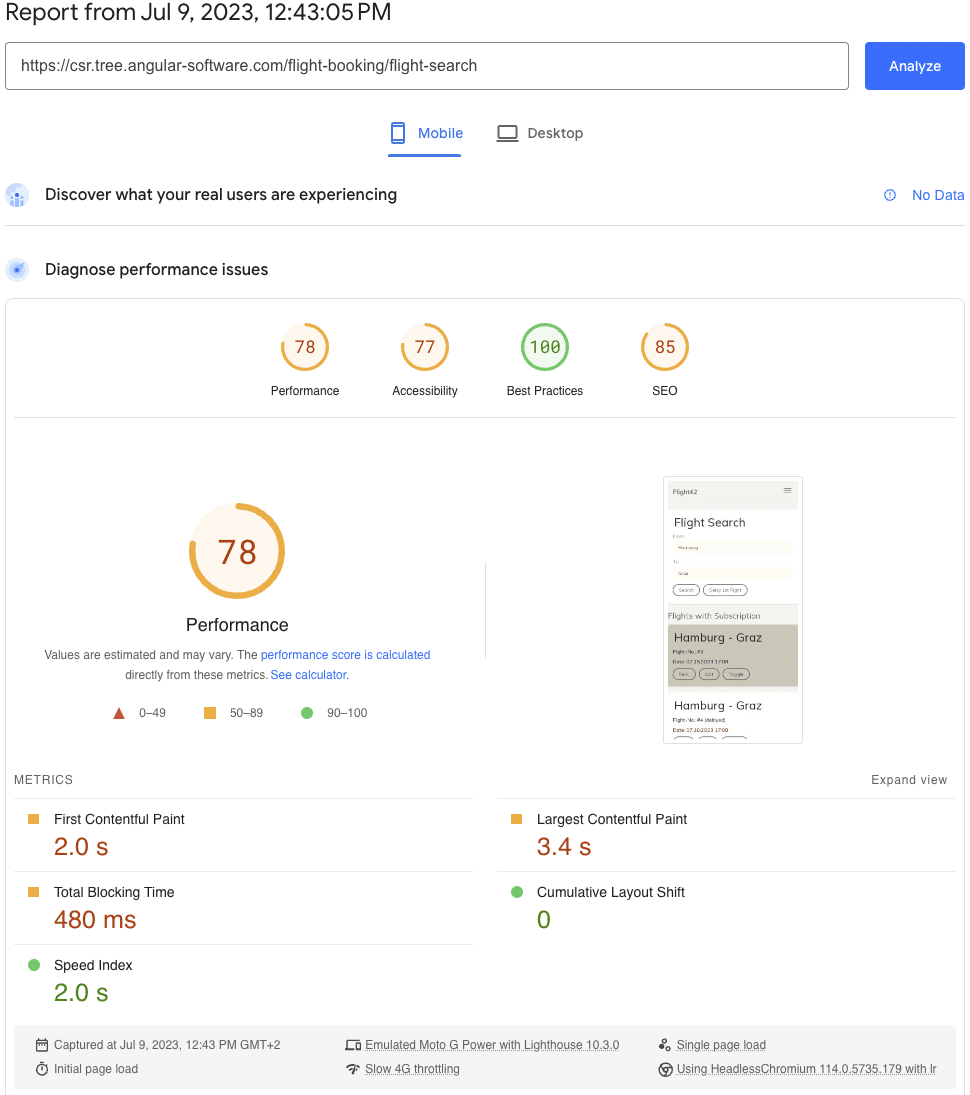
Illustration: Google PageSpeed Insights
If you're wondering why the two Lighthouse-based results differ 🤷 — it's simply something we have to accept. Here's a side-by-side comparison of the two tools:
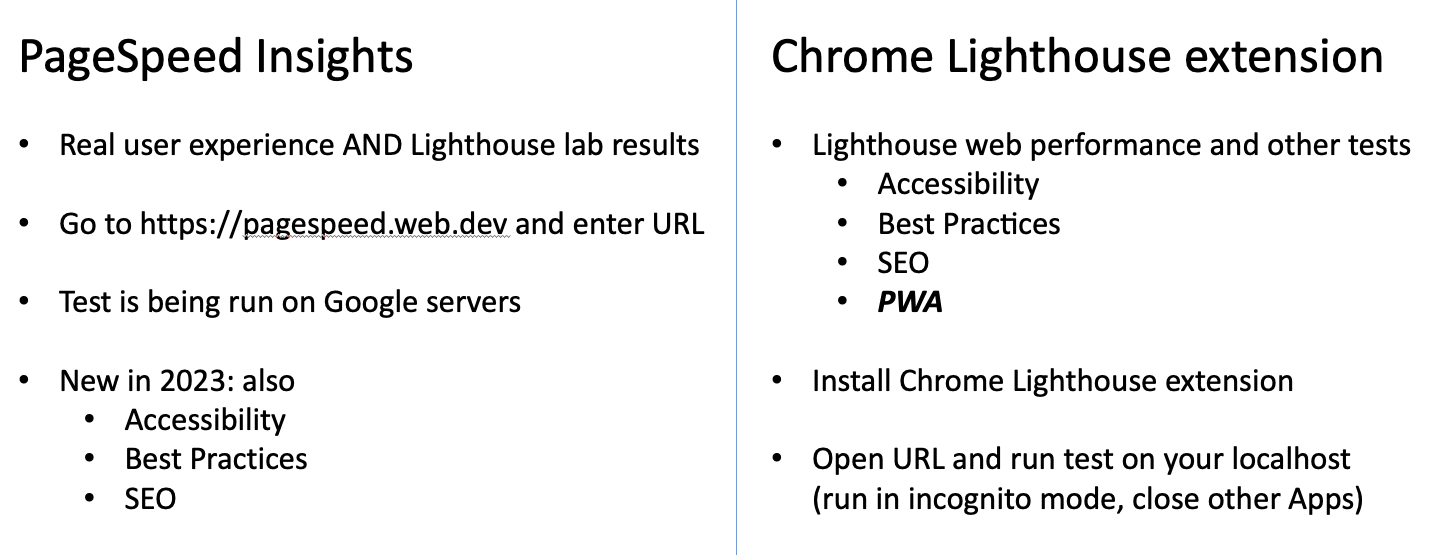
Illustration: Google PageSpeed vs Lighthouse
- Webpagetest.org: A well-established and widely used performance tool that provides detailed diagnostics on how a page behaves under various conditions. It uses the same metrics as Google Lighthouse. The online version allows tests to be run from different locations worldwide, on real browsers, and with customizable network throttling. It's essentially a more configurable alternative to PageSpeed Insights.
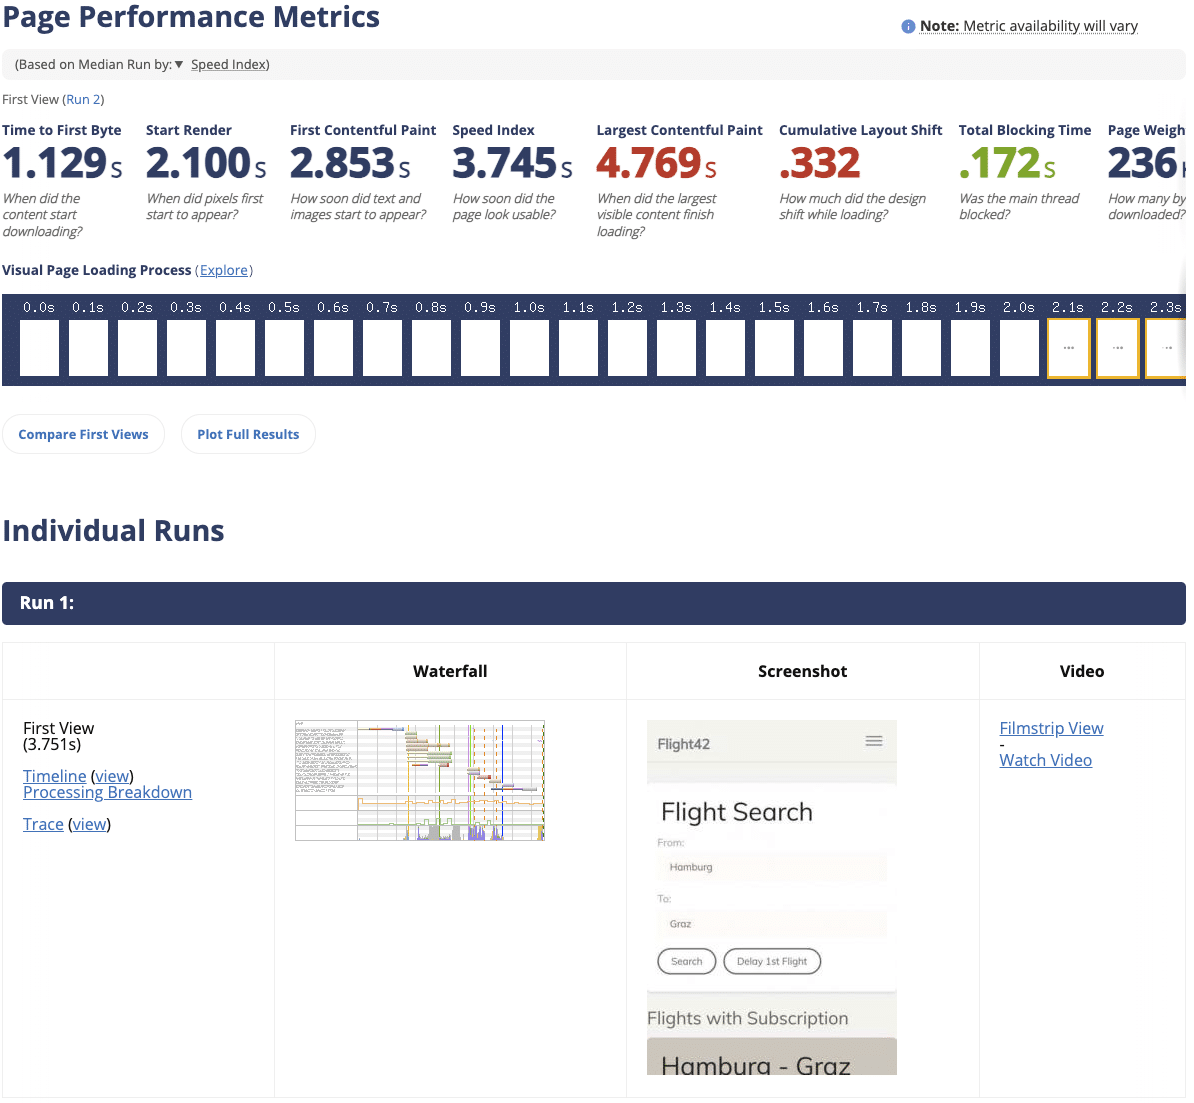
Illustration: Webpagetest.org
Performance Deep Dive Workshop
For those interested in a deeper dive into Angular Performance, we offer a dedicated workshop — available in both English and German:
- Performance Workshop 🚀
- Best Practices Workshop 📈 (includes performance topics)
- Accessibility Workshop ♿
Conclusion
In this guide, I demonstrated how to easily measure and compare your Initial Load Performance. Leveraging metrics and measurement tools is key to assessing your Angular app's speed and user experience, as well as uncovering areas for improvement.
These tools deliver objective data, help detect bottlenecks, provide user-centric insights, enable benchmarking, suggest optimizations, and support continuous monitoring for ongoing improvements.
In the upcoming part III, I'll show you how to use Angular SSR with Hydration. I'll use PageSpeed Insights to demonstrate the Initial Load Performance gains.
This post was written by Alexander Thalhammer. Follow me on Linkedin, X or giThub.