
Debugging stands as one of those essential abilities that every developer relies on daily. In this opening installment of a mini-series focused on Angular debugging techniques, we will look at practical ways to sharpen your troubleshooting workflow.
1. Angular Devtools
Angular DevTools is a browser extension for Chrome, available through the Chrome Web Store. Once installed, it activates exclusively when your app operates in development mode, appearing under a dedicated tab labeled Angular. This tab separates into two distinct panels: Components and Profiler.

Within the Components panel, you can inspect properties, inputs, and outputs for any given component. This proves especially valuable when you are dealing with deeply nested component hierarchies, where locating the right piece of code can become tedious. By tweaking property values directly from this view, you can observe how a component reacts to different data states. Additionally, this panel offers quick links to both the component's source file and its corresponding location in the Elements tab.
The Profiler panel lets you record and analyze change detection cycles along with what triggered them. Each cycle appears as a visual bar, making it easy to trace when and why re-renders happen. This overview helps in identifying areas that might be causing performance issues. The panel includes several views that allow you to filter by component and examine how long each one took to update.

keep reading — you will see how staying current with framework versions can simplify your debugging routine! 🎁
2. json pipe
The official Angular documentation describes the JSON pipe as a tool that "converts a value into its JSON-format representation. Useful for debugging."
This built-in impure pipe requires only the import of CommonModule. For projects utilizing standalone components, the pipe itself can be imported directly into the component where it is needed. Its main benefit is rendering the target object directly on the page, giving you a live view of its current state. This becomes particularly useful when combined with [(ngModel)] for two-way binding — you can watch data mutate in real time and catch issues the moment they appear.
@Component({
  selector: 'json-pipe',
  template: `<div>
    <p>Without JSON pipe:</p>
    <pre>{{place}}</pre>
    <p>With JSON pipe:</p>
    <pre>{{place | json}}</pre>
  </div>`
})
export class JsonPipeComponent {
  place: any = {name: 'NYC', state: 'USA', address: {street: 'Fifth Avenue', numbers: [5, 9, 12]}};
}
3. Router debugging
Router-related bugs can surface unexpectedly, and Angular offers configuration options to make diagnosing them easier. The extra options passed to RouterModule include one notable flag: enableTracing. Setting this to true results in every internal router navigation event being printed to the browser console.
RouterModule.forRoot(appRoutes, { enableTracing: true });When working with standalone components, the equivalent approach involves adding the withDebugTracing function within the bootstrapApplication setup.
const appRoutes: Routes = [];
bootstrapApplication(AppComponent,
  {
    providers: [
      provideRouter(appRoutes, withDebugTracing())
    ]
  }
);
Additionally, you can subscribe to specific event types. By injecting the Router service into a component, you gain control over navigation events. For example, you might want to manage an isLoading$ property to show a loading indicator whenever it emits true.
isLoading$ = new BehaviorSubject<boolean>(false);

constructor(private router: Router) {
  this.router.events
    .subscribe((event) => {
      if (event instanceof NavigationStart) {
        this.isLoading$.next(true);
      }
      else if (event instanceof NavigationEnd) {
        this.isLoading$.next(false);
      }
    });
}
Bonus Info 🎁
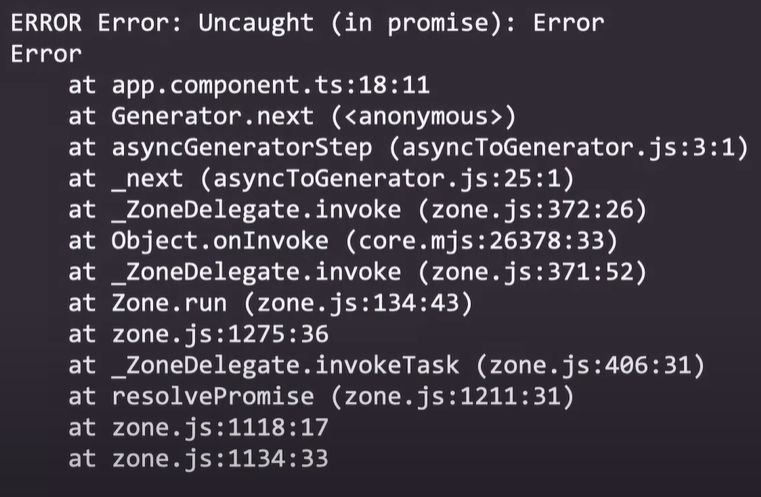
One of the most fundamental debugging skills is properly interpreting error messages. Starting with Angular v15, this experience has improved significantly. Stack traces are now far more descriptive, and errors point directly to the relevant lines in your code.
Before Angular V15 ⏪
After Angular V15 ⏩
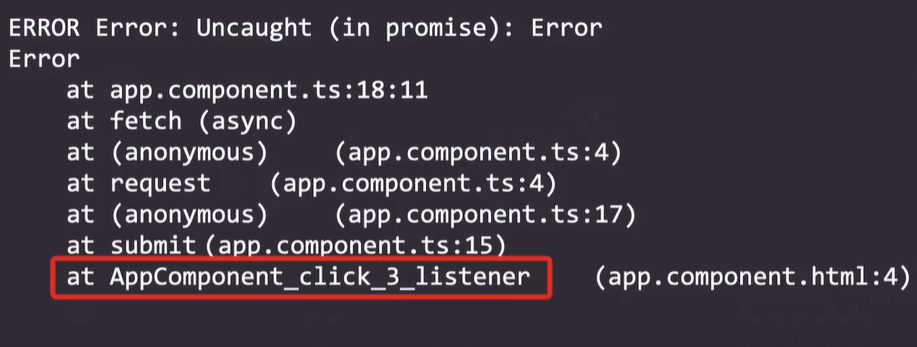
Consider upgrading to newer framework releases to benefit from enhancements such as these. For more details, check out the video produced by the Angular team.
That wraps up this edition! Thanks for reading. Feel free to share your thoughts in the comments. And don’t miss the video courses on Decoded Frontend to take your Angular skills further!