Angular DevTools
Angular DevTools is a browser extension designed to offer debugging and profiling features for Angular applications.
The official documentation covers its functionality comprehensively.
In this piece, I’ll outline the internal architecture of the tool and describe the utilities it relies on to construct
a components tree and a change detection profiler.
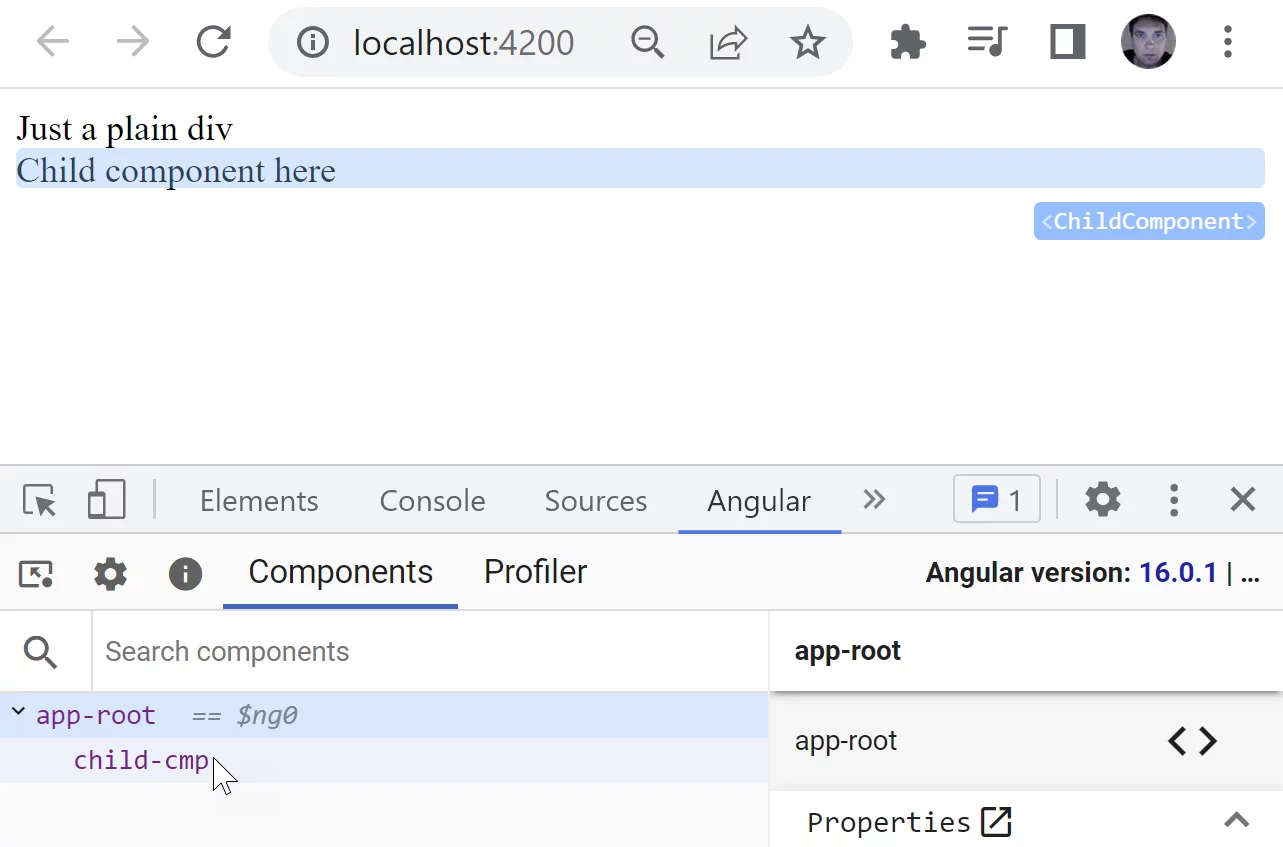
The "Components" tab displays a component hierarchy for the currently loaded application page:
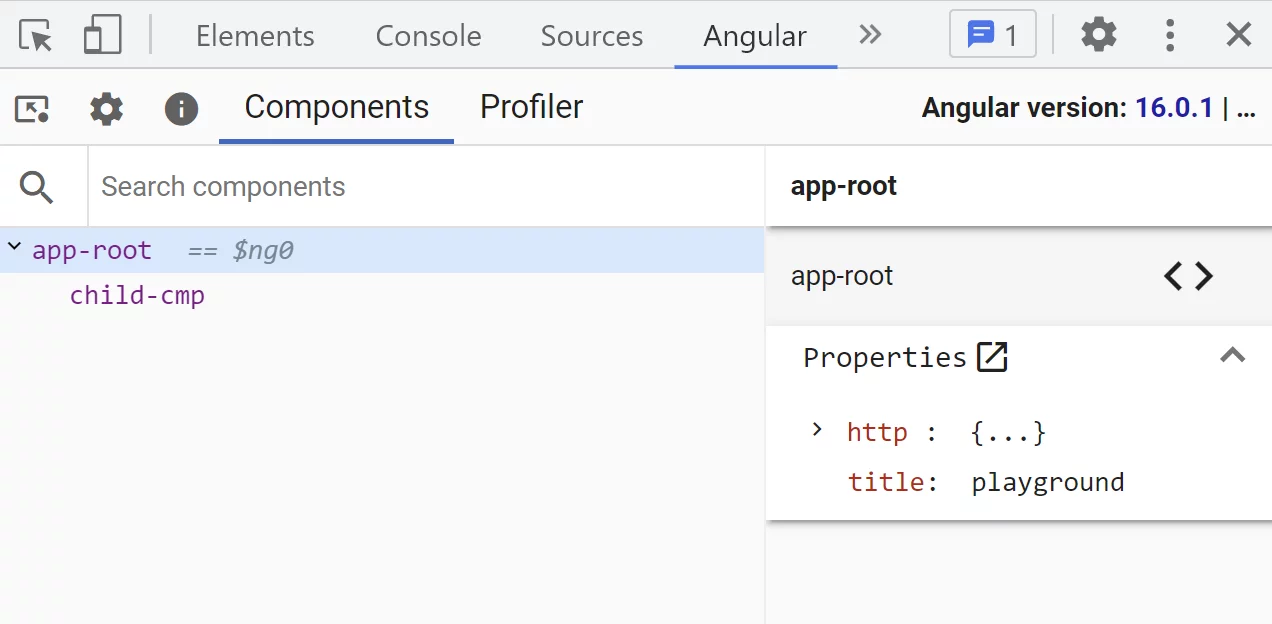
What’s notable—though hardly unexpected—is that the DevTools extension itself is built with Angular to render the interface you see in the Chrome console.
This user-facing part of the extension can be viewed as a regular frontend application running in the browser.
Take those two tabs, for instance:
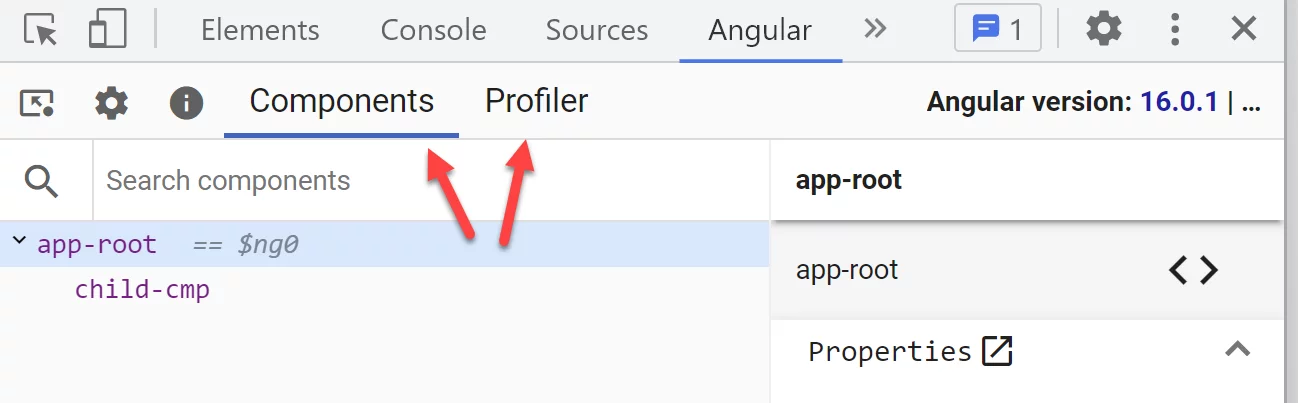
they are managed by the
DevToolsTabs
component. This component resides in the ng-devtools module within the source code:
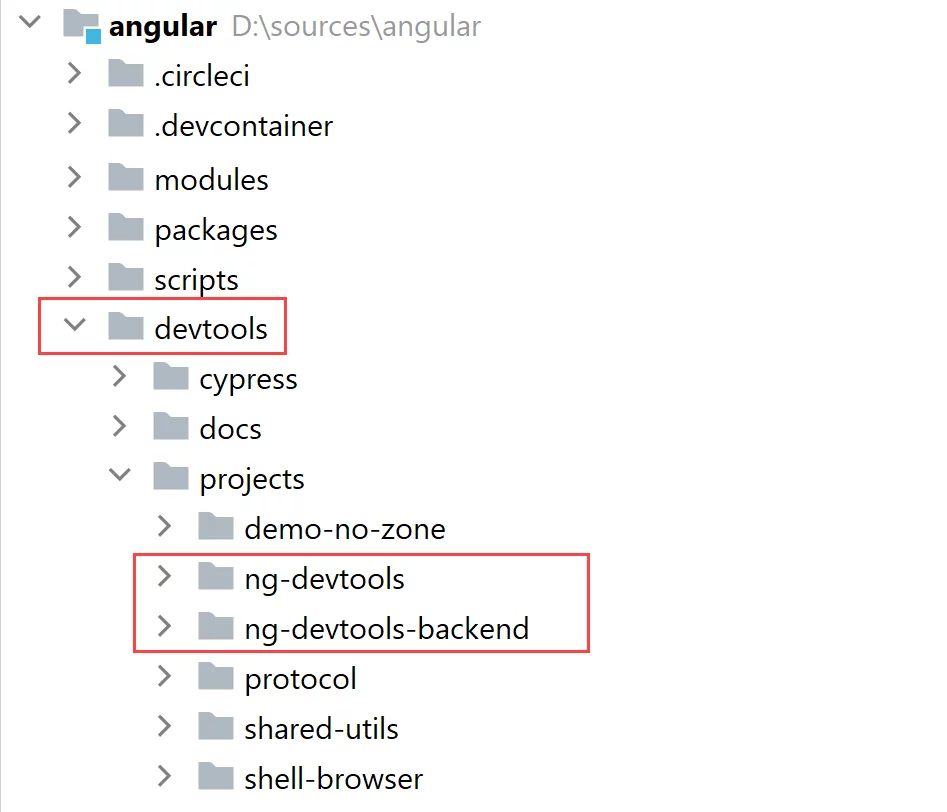
Notice that there’s also an ng-devtools-backend implementation responsible for communicating with your Angular application.
Its main responsibility is constructing the components tree that the frontend portion of the DevTools extension subsequently displays.
Beyond that, it handles various other tasks, such as
highlighting
a node in the inspected Angular app by attaching styles to that node:
The frontend and backend portions of the DevTools extension exchange data through a
message bus:
export abstract class MessageBus<T> {
  abstract on<E extends keyof T>(topic: E, cb: T[E]): void;
  abstract once<E extends keyof T>(topic: E, cb: T[E]): void;
  abstract emit<E extends keyof T>(topic: E, args?: Parameters<T[E]>): boolean;
  abstract destroy(): void;
}
Here’s an example
showing how
Angular listens for the createHighlightOverlay event, which triggers the highlighting mechanism:
const setupInspector = (messageBus: MessageBus<Events>) => {
  const inspector = new ComponentInspector({...});

  messageBus.on('createHighlightOverlay', (position: ElementPosition) => {
    inspector.highlightByPosition(position);
  });
Leveraging discovery utilities
To construct the component tree and attach relevant metadata, the extension relies on the same discovery
utilities examined in the global utils section.
These utilities are utilized by the
RStrategy,
which serves as the primary mechanism Angular uses to inspect the component tree.
This strategy becomes the default whenever the discovery utilities are accessible globally:
export class RTreeStrategy {
  supports(_: any): boolean {
    return ['getDirectiveMetadata', 'getComponent', 'getDirectives'].every(
        (method) => typeof (window as any).ng[method] === 'function');
  }

  build(element: Element): ComponentTreeNode[] {
    // We want to start from the root element so that we can find components which are attached to
    // the application ref and which host elements have been inserted with DOM APIs.
    while (element.parentElement) {
      element = element.parentElement;
    }
    const getComponent = (window as any).ng.getComponent as (element: Element) => {};
    const getDirectives = (window as any).ng.getDirectives as (node: Node) => {}[];
    const result = extractViewTree(element, [], getComponent, getDirectives);
    return result;
  }
}
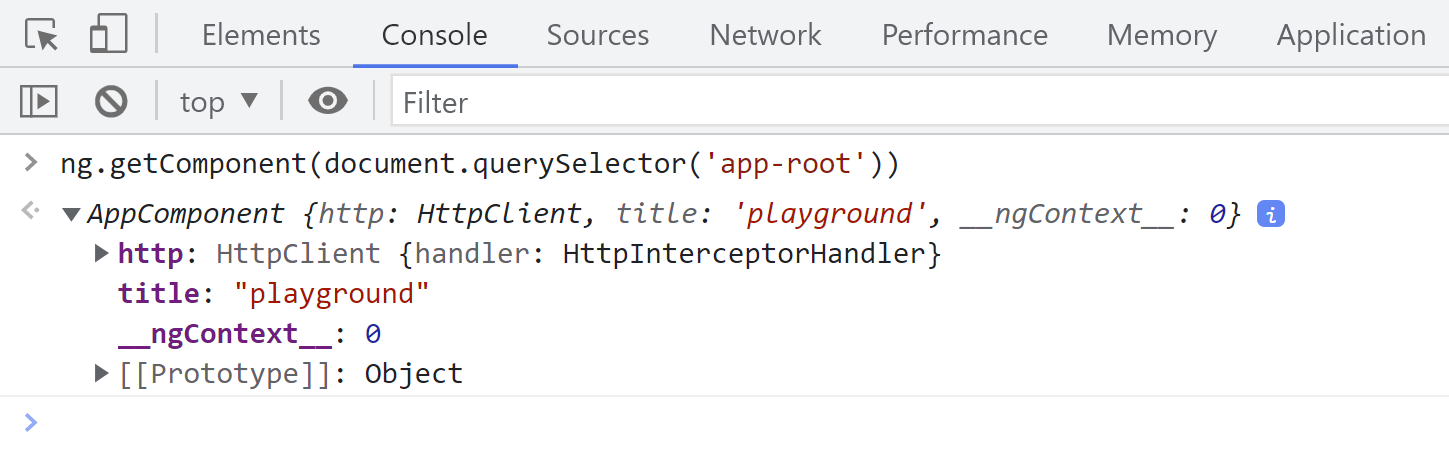
Consequently, the details shown here:

can be extracted and examined directly in the Chrome console via the ng.getComponent utility:
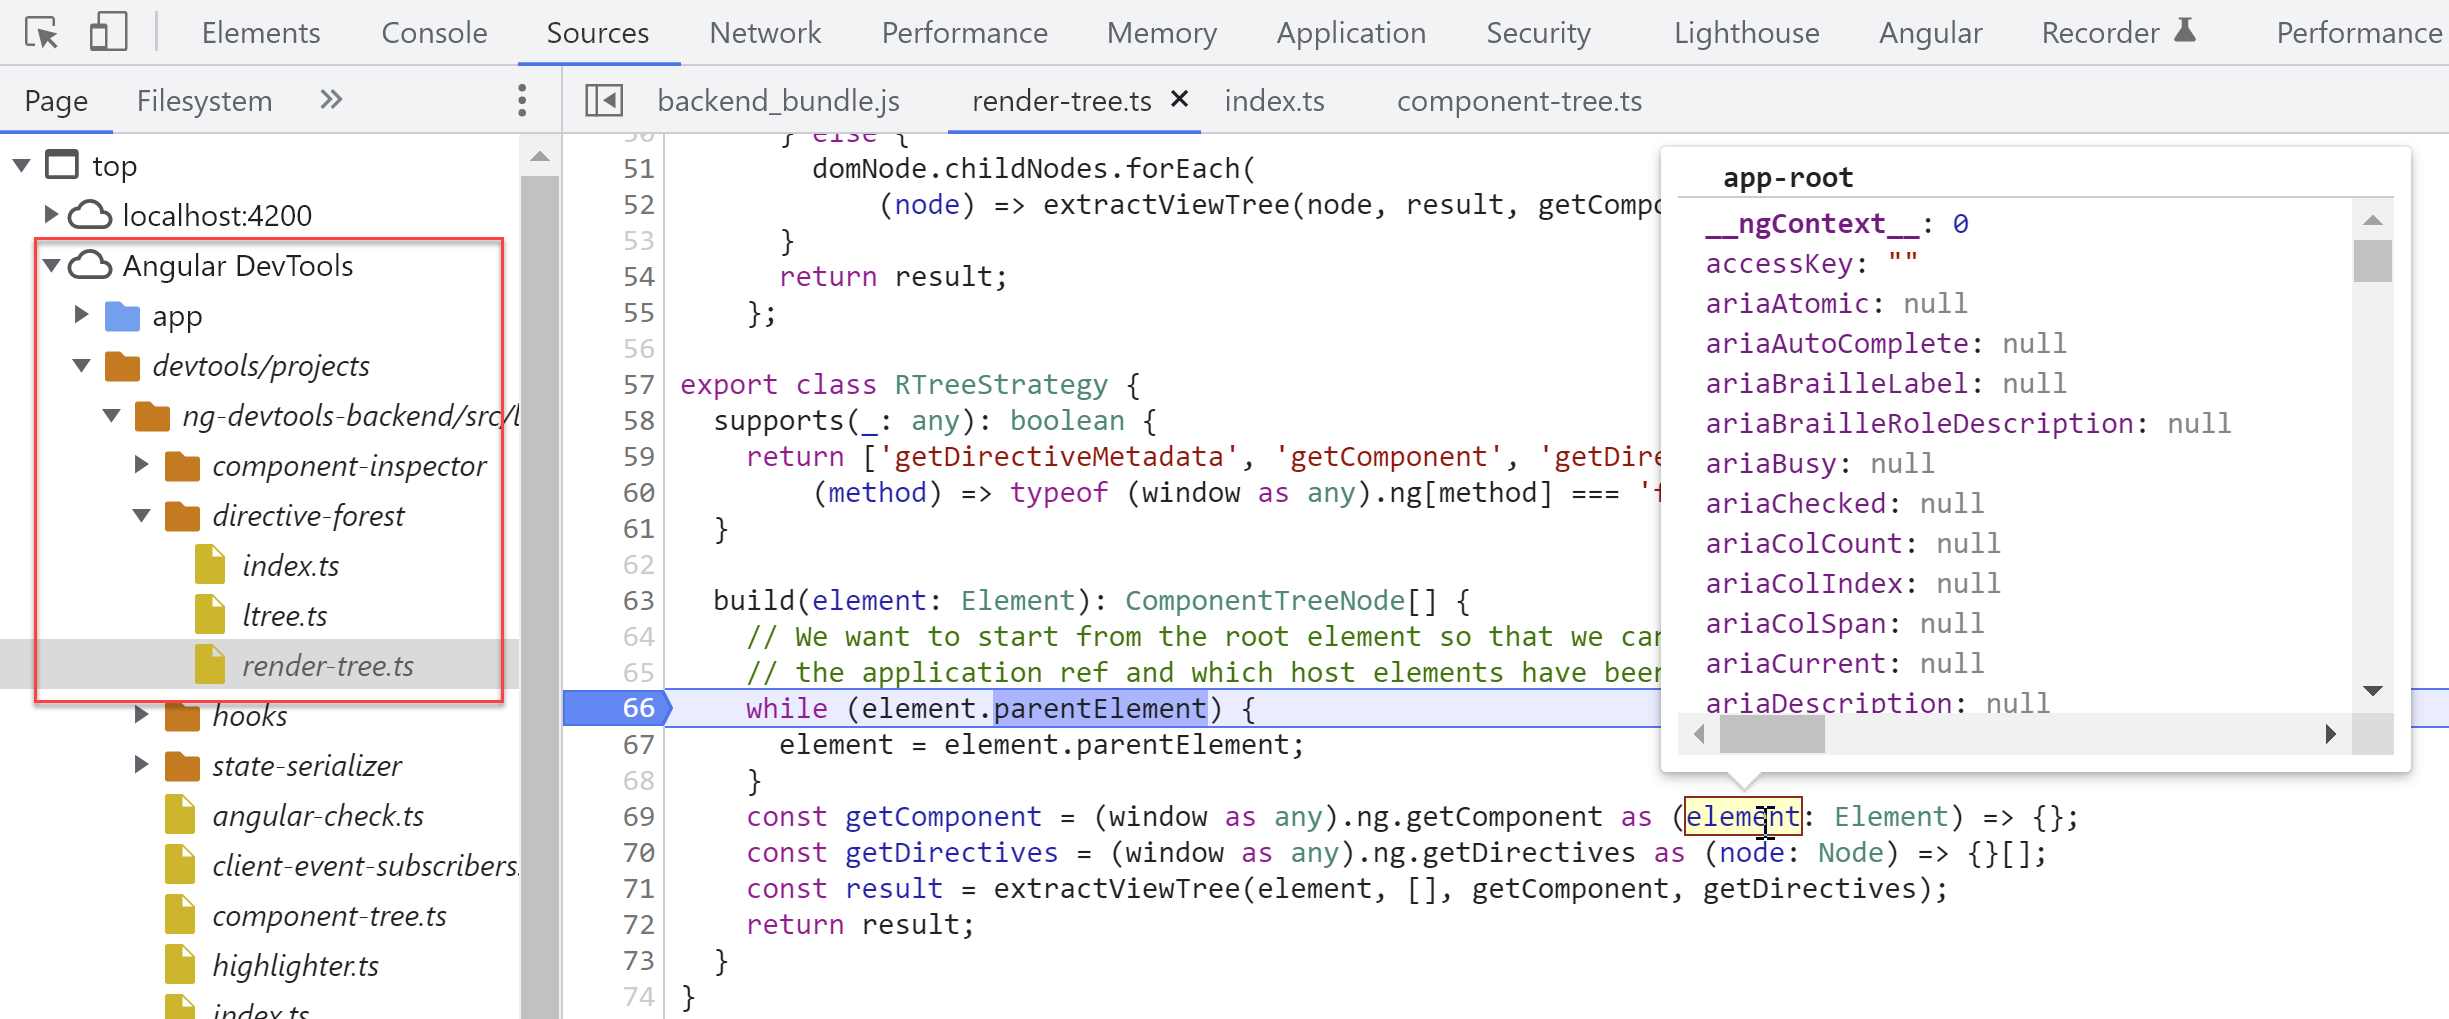
If you’re interested in observing how this unfolds within the strategy’s build method,
you could place a breakpoint in the extension’s source code itself:
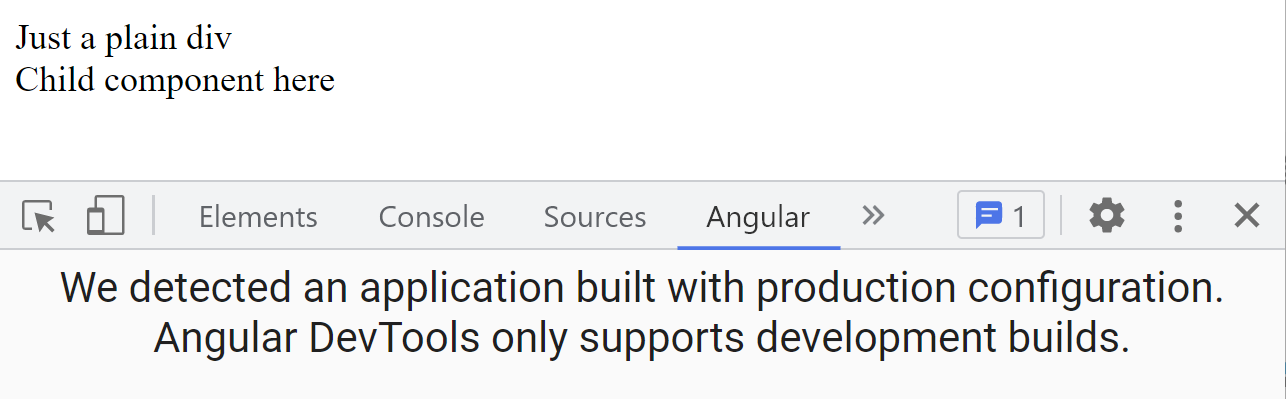
Conversely, when Angular operates in production mode, the framework does not expose the discovery utilities through the global ng namespace.
Because of this, inspecting an application running in production mode is not currently supported.
Attempting to launch DevTools in that scenario produces the following message:
There’s the
LTreeStrategy
in development that might enable this scenario in the future. This strategy depends on the custom
ngContext
DOM element property to access the corresponding LView and TNode.
The strategy leverages these nodes to pull meta information about a component or its directives:
export class LTreeStrategy {
  supports(element: Element): boolean {
    return typeof (element as any).__ngContext__ !== 'undefined';
  }

  private _getNode(lView: any, data: any, idx: number): ComponentTreeNode {
    const directives: DirectiveInstanceType[] = [];
    let component: ComponentInstanceType|null = null;

    const tNode = data[idx];
    const node = lView[idx][ELEMENT];

    for (let i = tNode.directiveStart; i < tNode.directiveEnd; i++) {
      const instance = lView[i];
      const dirMeta = data[i];
      if (dirMeta && dirMeta.template) {
        component = { ... };
      } else if (dirMeta) {
        directives.push({... });
      }
    }
  }
}
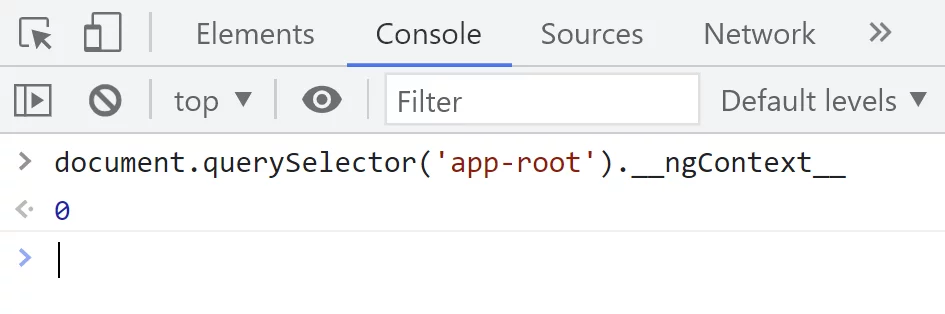
The custom __ngContext__ property is present even in production environments at this stage.
To access the LView, Angular stores the id of the relevant LView
within the __ngContext__ property on each component’s host element:
It then retrieves it via getLViewById from the
TRACKED_LVIEWS
storage:
/** Starts tracking an LView. */
export function registerLView(lView: LView): void {
  ngDevMode &&
    assertNumber(lView[ID], 'LView must have an ID in order to be registered');
  TRACKED_LVIEWS.set(lView[ID], lView);
}

/** Gets an LView by its unique ID. */
export function getLViewById(id: number): LView | null {
  ngDevMode && assertNumber(id, 'ID used for LView lookup must be a number');
  return TRACKED_LVIEWS.get(id) || null;
}
Through this approach, Angular enables LView retrieval at runtime, even in production mode.
That’s precisely what LTreeStrategy takes advantage of.
How profiling works
The "Profiler" tab offers an in-depth view of Angular’s change detection process.
After clicking the "Start recording" button, Angular DevTools begins capturing change detection execution events,
including things like template updates or lifecycle hook invocations.
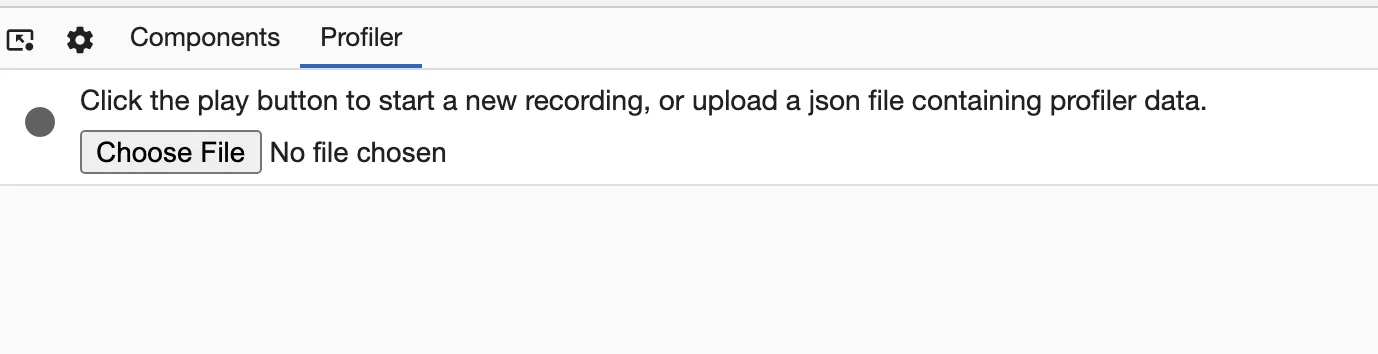
Once recording of the change detection process comes to a halt, the data appears like this:
The backend portion of the DevTools extension handles capturing these events and constructing frames. For this purpose, the profiler
employs
a strategy known as
NgProfiler.
This strategy sets up a callback through the same
setProfiler
function discussed in the previous section.
When a particular change detection event reaches the callback, the associated
hook
gets activated:
const getHooks = (onFrame) => {
  const timeStartMap: Record<string, number> = {};
  return {
    onCreate,
    onChangeDetectionStart,
    onChangeDetectionEnd,
    onDestroy,
    onLifecycleHookStart,
    onLifecycleHookEnd,
    onOutputStart,
    onOutputEnd,
  };
};
Looking at the hook structure, most events come in start and end pairs.
Within the hook, when a start version of a change detection event arrives, Angular logs the timestamp in the
timeStartMap.
When the matching end version arrives, it
determines the duration
by measuring the interval between the start and end points of the event.
Here’s how that works for the onOutput[Start/End] event:
const getHooks = (onFrame) => {
	const timeStartMap: Record<string, number> = {};
	return {
		...,
		onOutputStart(componentOrDirective, outputName, node, isComponent) {
		  startEvent(timeStartMap, componentOrDirective, outputName);
		  ...
		},
		onOutputEnd(componentOrDirective: any, outputName: string): void {
		  const name = outputName;
		  const entry = eventMap.get(componentOrDirective);
		  const startTimestamp = getEventStart(timeStartMap, componentOrDirective, name);
		  ...
		  const duration = performance.now() - startTimestamp;
		  entry.outputs[name] = (entry.outputs[name] || 0) + duration;
		  frameDuration += duration;
		},
	}
}
After the full change detection cycle is documented, the data gets
transmitted
to the frontend for further processing. The output is then presented by the
TimelineComponent.