Let’s briefly examine how the different layers of a typical Angular web application interact and what role each one plays.
We'll start with a high-level view, then move into the specifics.
As explained earlier, the app’s state serves as the driving force behind all screen updates.
The state is what populates the DOM, and the browser in turn leverages that DOM to render text, images, buttons, and other visual elements.
Asynchronous events originating from user interactions trigger updates to the application state.
Angular requires knowledge of when these events occur so it can track potential state changes.
This is where the zone.js package becomes essential.
It works by decorating (patching) browser platform APIs, enabling interception of every asynchronous operation in the browser.
Angular taps into hooks provided by zone.js and treats signals from DOM events, timeouts, AJAX/XHR, Promise, and more as a trigger to execute change detection in Big Picture.
The underlying assumption is that most asynchronous events lead to state changes that must be propagated to the DOM and, as a result, to the user's screen.
This mechanism enables change detection to fire automatically following any async event.
After the event's handler completes its execution, Angular initiates change detection.
Rather than dealing with zone.js directly, Angular relies on NgZone,
a thin layer built around zone.js that filters out certain events to limit what Angular gets notified about
(further details in the chapter dedicated to zone.js).
So, what is the connection between Angular and zones?
Whenever an event connected to the Angular zone (NgZone) is triggered, a corresponding event handler fires.
Commonly, this handler is a method exposed by a component.
The business logic embedded there has the liberty to modify any data, whether it be the shared application model or the component’s local view state.
Once NgZone signals that all microtasks have been resolved, Angular then launches its change detection algorithm.
Under standard settings (meaning none of your components adopt the onPush change detection strategy),
the framework iterates over every component in the tree starting from the top and moving down, in a depth-first fashion (see the “order of checks” here).
When running in dev mode, change detection performs a second pass to verify the state is stable due to the additional check Angular carries out
(refer to the chapter on unidirectional data flow). This process scrutinizes all bindings for dirtiness via change detector objects.
Lifecycle hooks, queries, and bindings are all handled within the change detection cycle
(see the chapter focusing on operations for a detailed breakdown).
In Angular, every component corresponds to a data construct known as LView.
This structure stores the most recent values for every template binding, including expressions like {{service.a}}.
During change detection, these stored values undergo dirty checking to see whether any side effect tied to a change should be triggered.
A component instance and its corresponding LView share a one-to-one mapping.
Angular wraps an LView
using the ChangeDetectorRef service,
which exposes change detection capabilities. This object can be injected into a component's constructor for direct access.
Every component has its own change detector instance, leading Angular to maintain a tree of these detectors that mirrors the component hierarchy.
This change detection structure forms a directed graph— supporting unidirectional data flow—and is guaranteed to be acyclic.
Now, JavaScript hands control back to the browser after the event is handled. The business logic has updated the application state, and Angular has already synced the DOM during its change detection run.
The browser then paints those changes to the screen and proceeds to execute any queued macrotasks, including network requests or timers.
Updating the screen follows a standard rendering-and-painting pipeline divided into distinct substages:
- [Rendering] Style calculations. The browser determines which CSS rules target which elements via selector matching, such as
.headlineor.nav > .nav__item. Once matched, these rules are applied to compute the final styles for each element. - [Rendering] Layout. With applicable rules known, the browser computes each element's dimensions and position on the viewport. Since the web's layout model allows one element to influence others—like the
<body>width cascading to its children—this process can become computationally intensive for the browser. - [Painting] Paint. This stage fills in pixels by rasterizing text, colors, images, borders, and shadows—every visible aspect of elements. Painting typically happens across multiple surfaces, often called layers.
- [Painting] Compositing. Layers painted in the prior stage must be merged onto the screen in the proper z-order. This becomes crucial for overlapping elements, as any ordering mistake could cause one component to incorrectly obscure another.
Not every frame triggers all pipeline substages.
If a change only modifies a “paint-only” property—like a background image, text color, or shadow—that doesn't impact page layout, the browser can ditch the layout step but still executes paint.
The optimal pipeline for performance skips every stage except compositing,
which is typical for animations or scroll interactions.
My next course module will dive deeper into the browser's responsibilities, with a focus on performance within Angular applications.
In the meantime, check out this excellent piece: The Anatomy of a Frame.
So this approach boils down to four actors:
- browser: rendering (style, layout), painting (painting, compositing)
- zone.js: monkey-patching browser API, tasks lifecycle management and notifications
- angular: change detection, DOM updates
- application: business logic, updating application state
Let's examine a concrete scenario.
An in-depth look
Consider this straightforward example:
import { Component } from '@angular/core';

@Component({
  selector: 'app-root',
  template: `
    <div class="container">
      <div>
        <button (click)="fetchData()">Fetch data</button>
        {{ status }}
        <div>title: {{ title }}</div>
      </div>
    </div>
  `,
  styleUrls: ['./app.component.css'],
})
export class AppComponent {
  title = 'learn-angular';
  status = null;

  fetchData() {
    this.status = 'Loading...';
    const req = new XMLHttpRequest();

    req.open('GET', 'https://jsonplaceholder.typicode.com/todos/1', true);

    req.onreadystatechange = () => {
      if (req.readyState === XMLHttpRequest.DONE && req.status === 200) {
        const todo = JSON.parse(req.responseText);
        this.title = todo.title;
        this.status = null;
      }
    };

    req.send(null);
  }
}
That works like this:
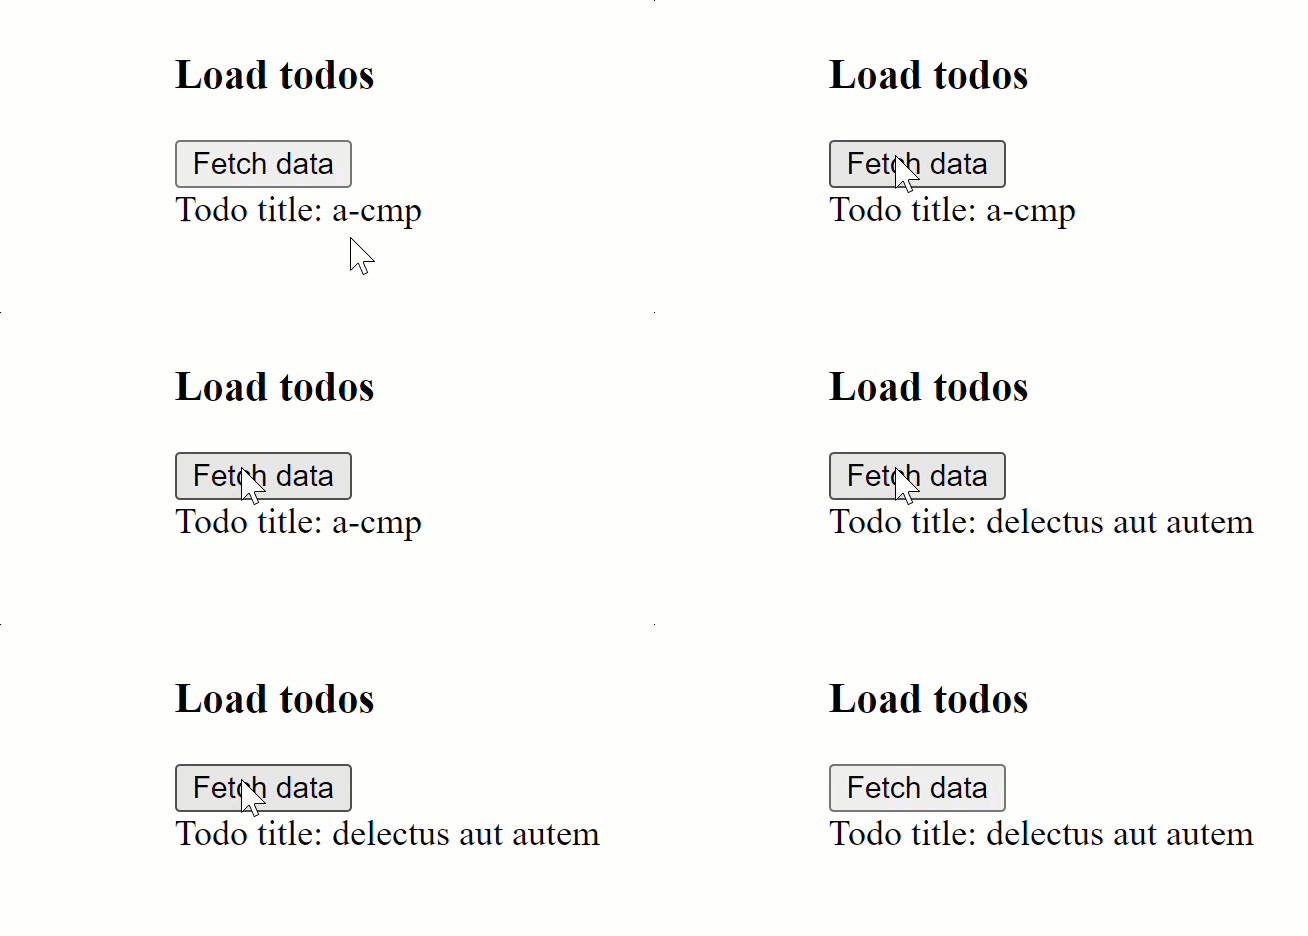
Here I choose XHR rather than fetch to keep the Profiler logs clean.
Since fetch relies on Promises, using it would add extra log entries caused by scheduling and processing microtasks.
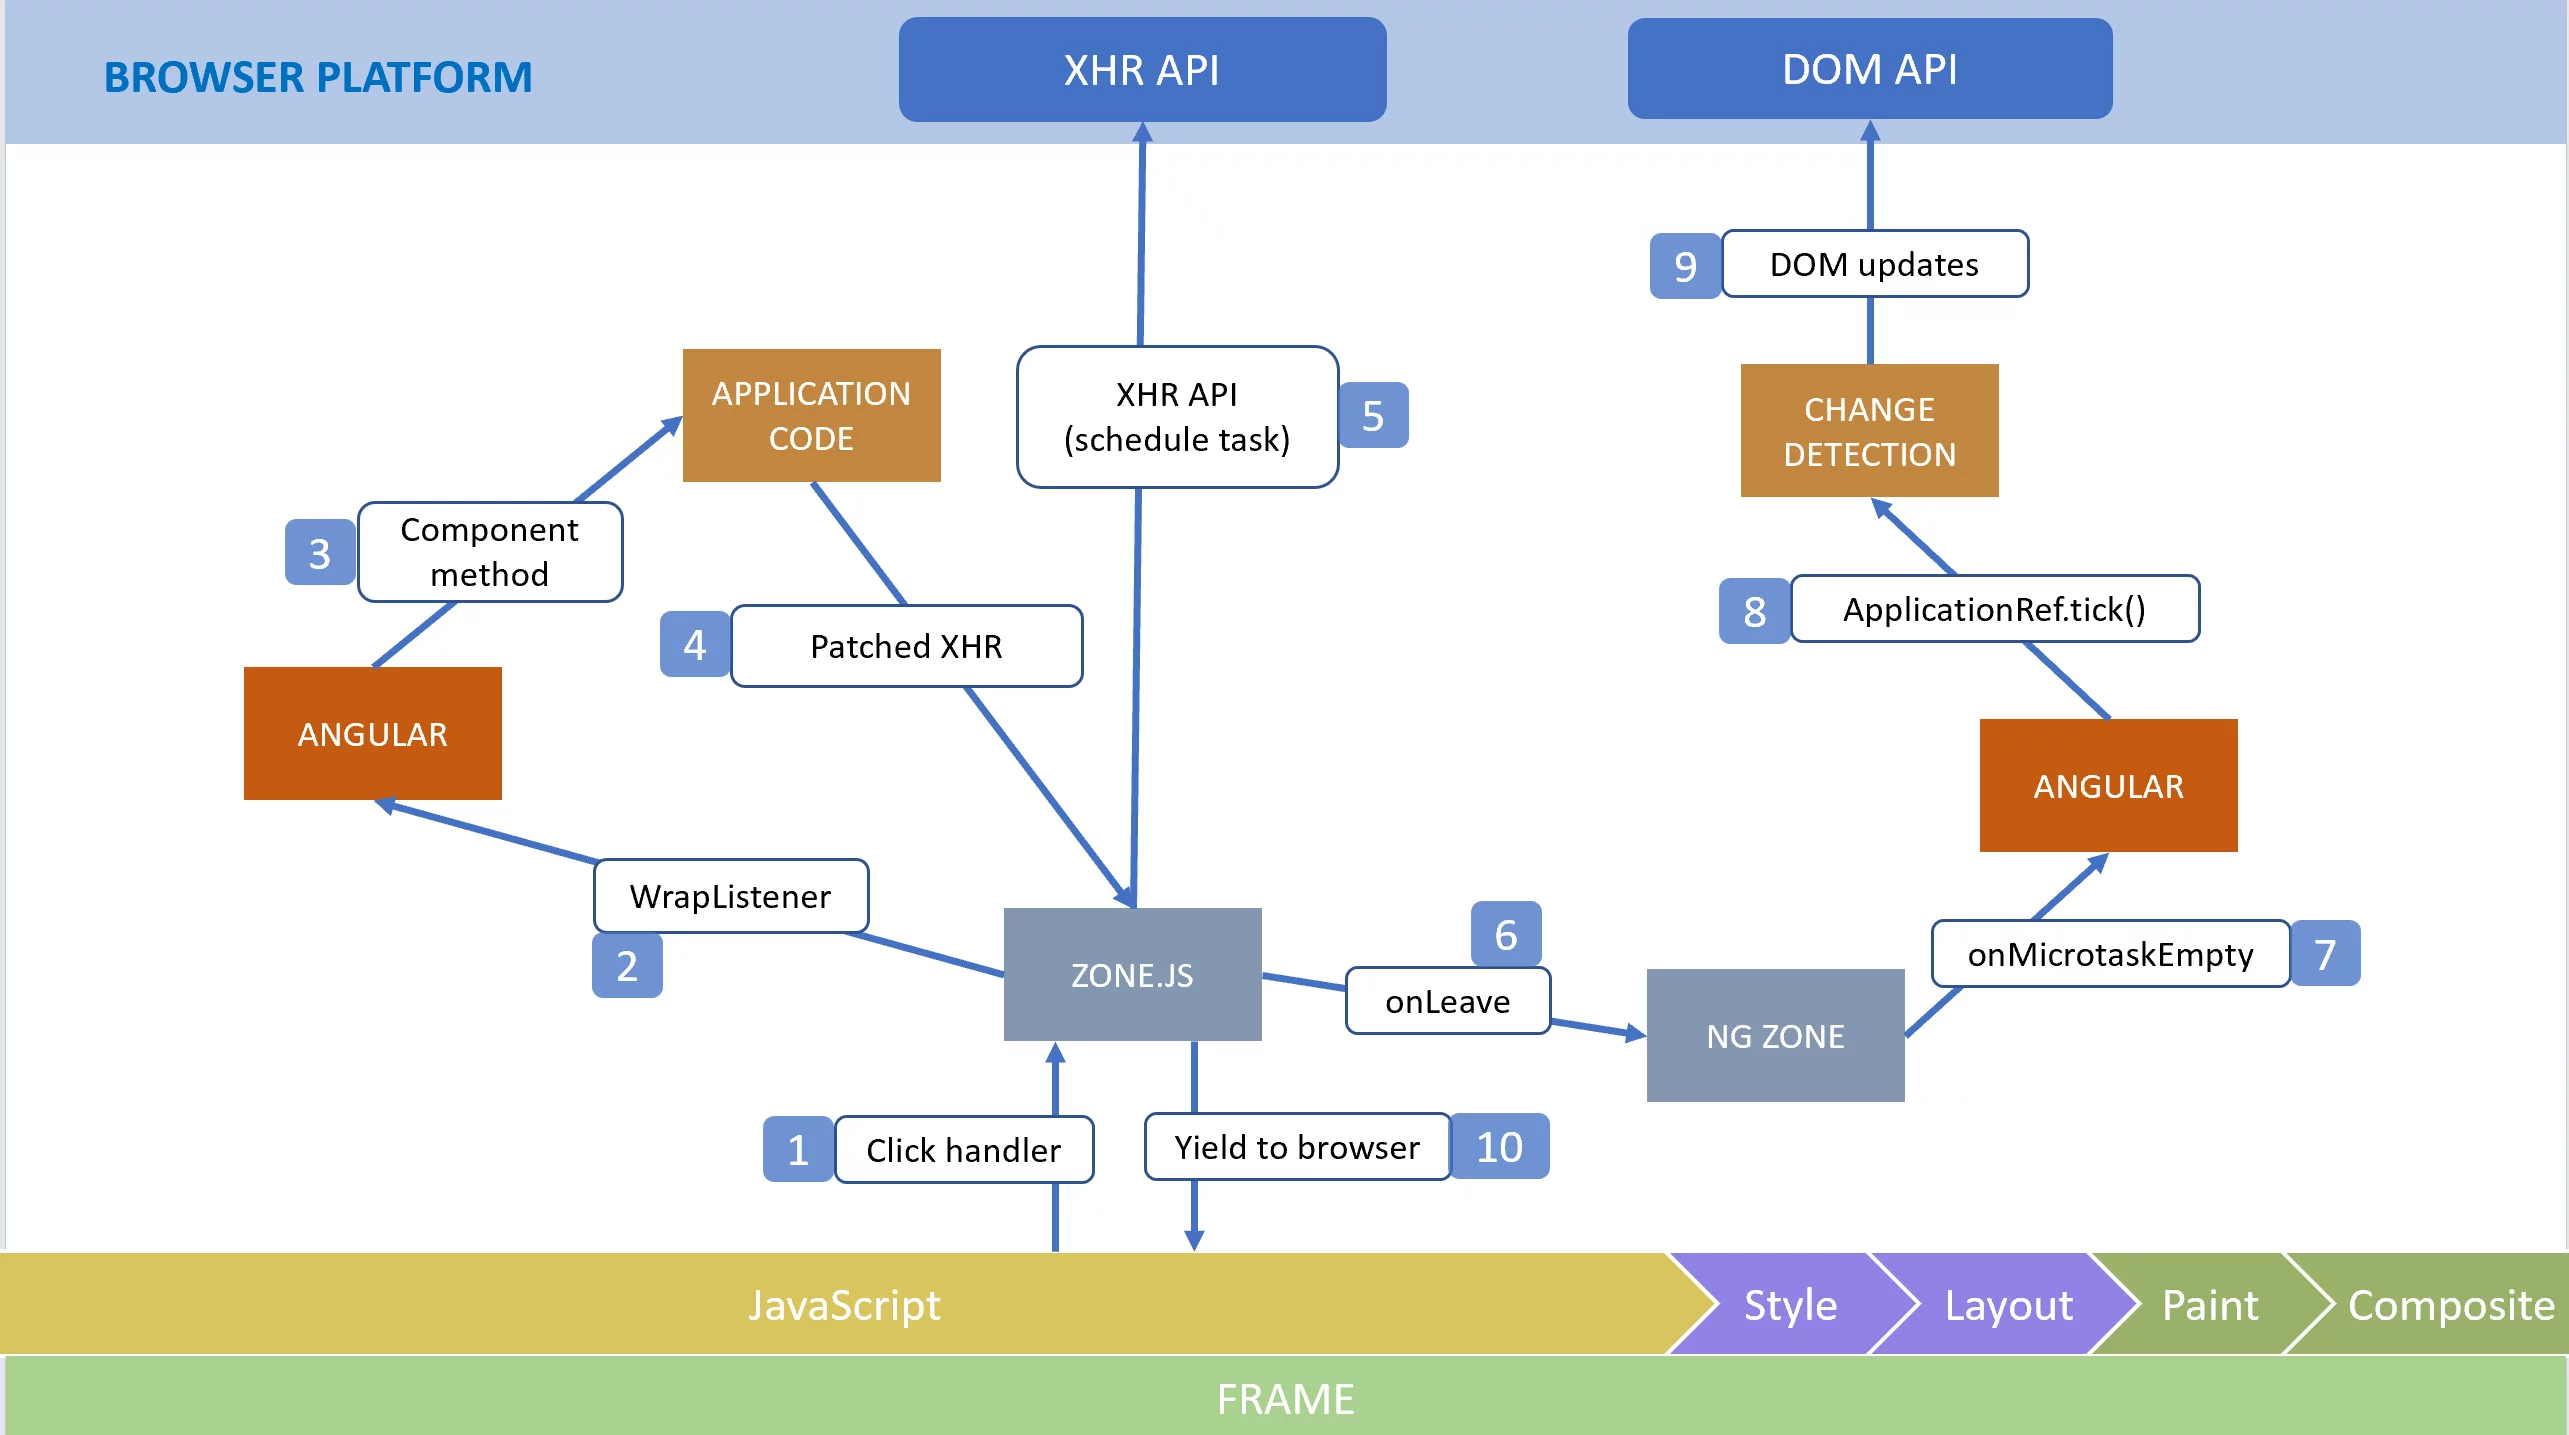
Now, a step-by-step walkthrough of the process:
- The browser registers a click and queues its handler on the event queue (browser part)
zone.jsbegins with zoneAwareCallback, which merely invokes the callback that Angular has registered- Angular runs the wrapper that encloses the template callback; this wrapper tags the view and all its ancestors as dirty
- Angular invokes the
fetchDatacomponent method via the event listener defined in the component template - The business logic within
fetchDatainitiates the network call zone.jscatches the request and arranges a macrotask with the browser- With the event now handled,
zone.jsusesNgZoneto fire onMicrotaskEmpty - Angular responds by performing change detection across the entire application, executed through ApplicationRef.tick
- Change detection modifies the DOM and triggers other side effects
- The browser paints the updated screen, then proceeds with the macrotask tied to the network request. Once the response arrives, the same cycle reoccurs, with this time the
onreadystatechangeevent handler being executed instead of theclickone. During the JavaScript phase, Angular executes change detection at the end. Afterwards, the browser runs through the rendering pipeline once more.
Illustrated on a diagram, this cycle takes the following shape:
You can observe all of this directly in the Chrome Dev Tools profiler.
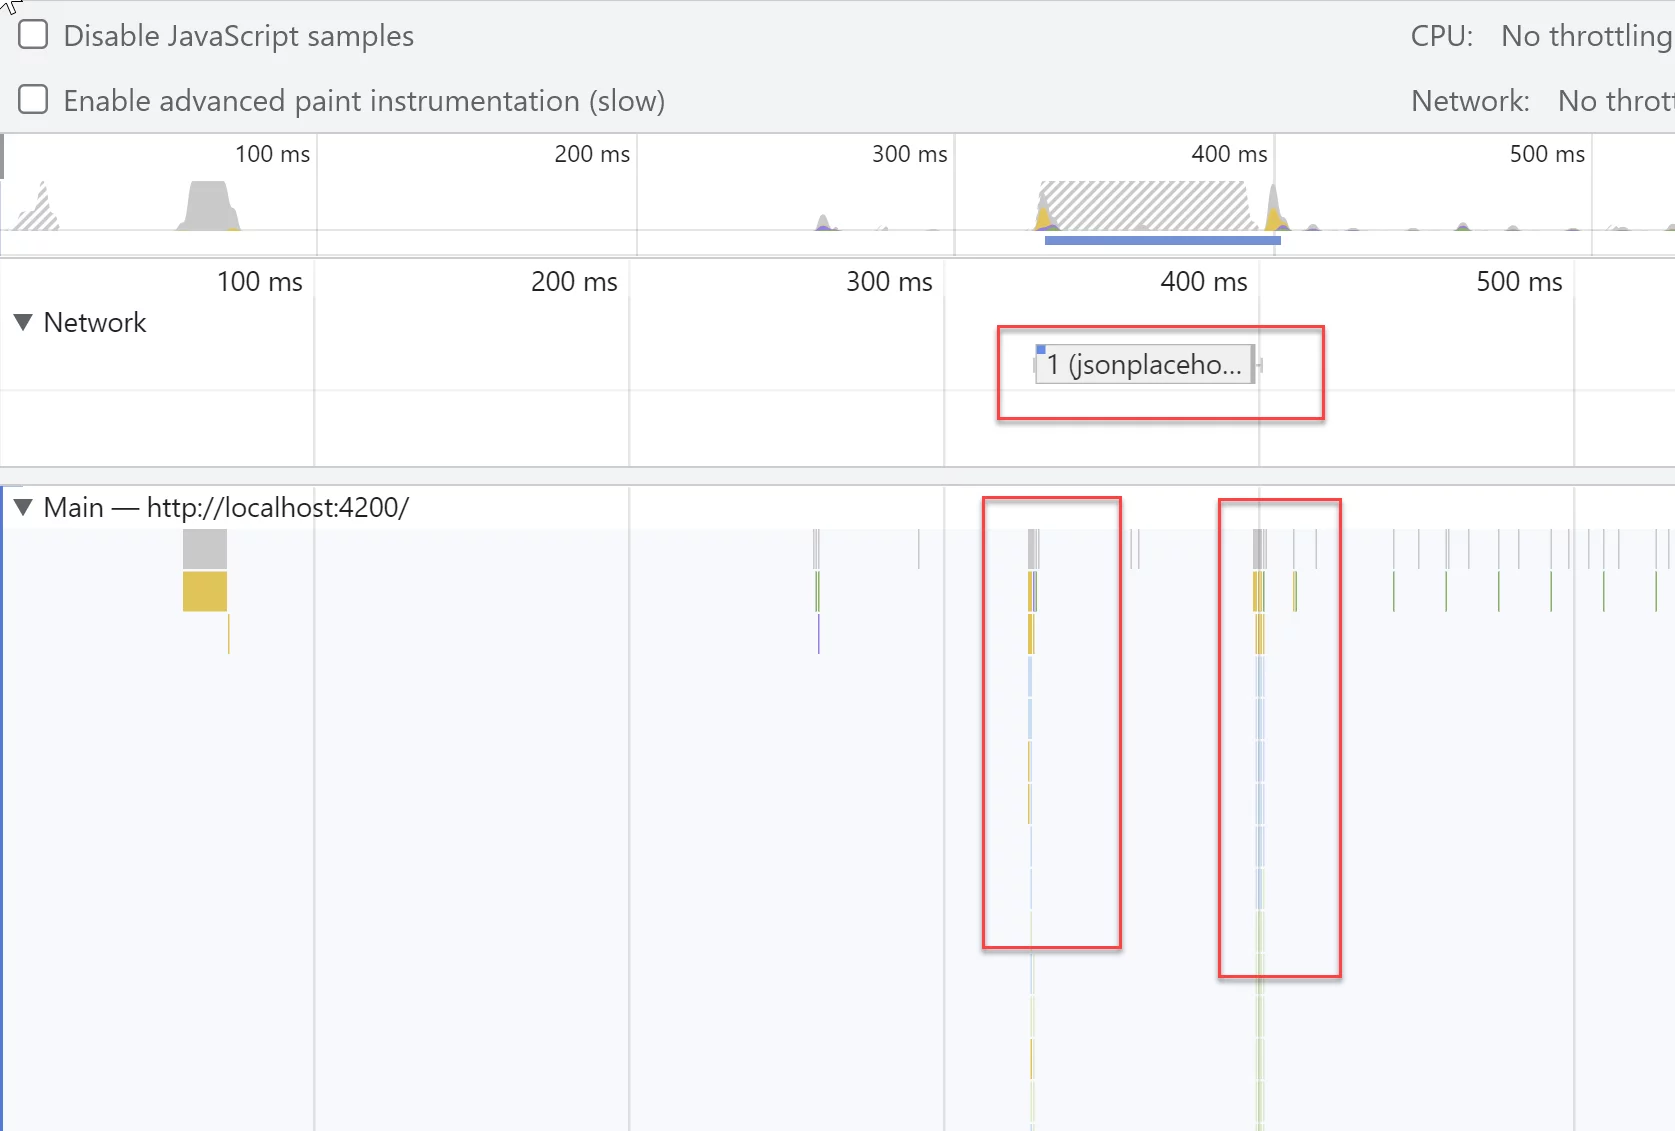
Open the Call Stack panel to inspect the sequence of function calls, then choose the Click event:
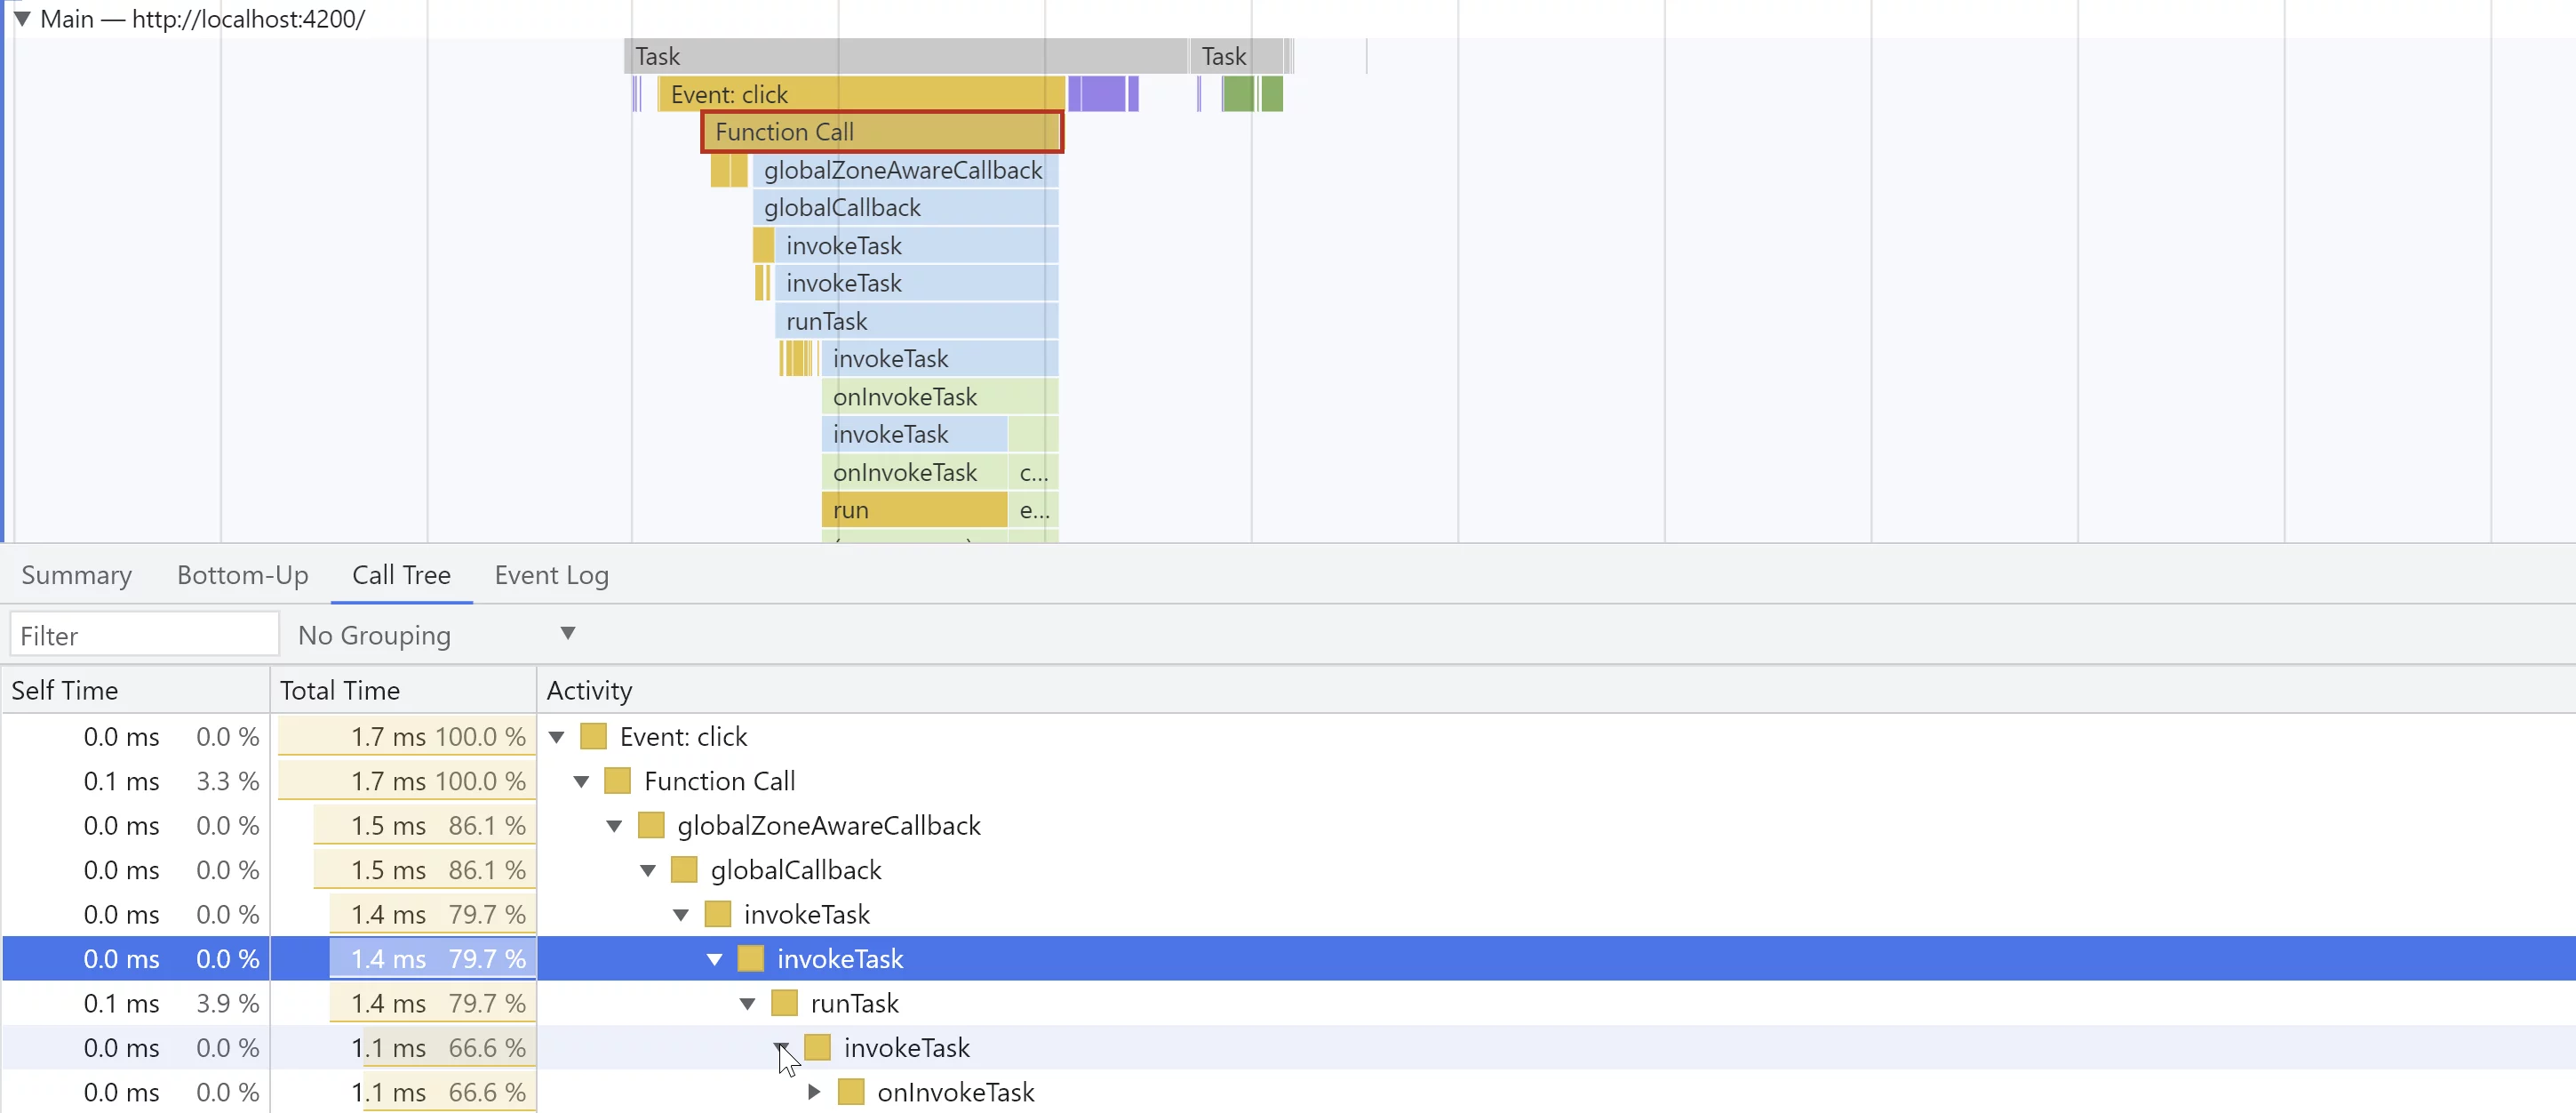
Let’s unfold this section and take a closer look at what lies beneath:
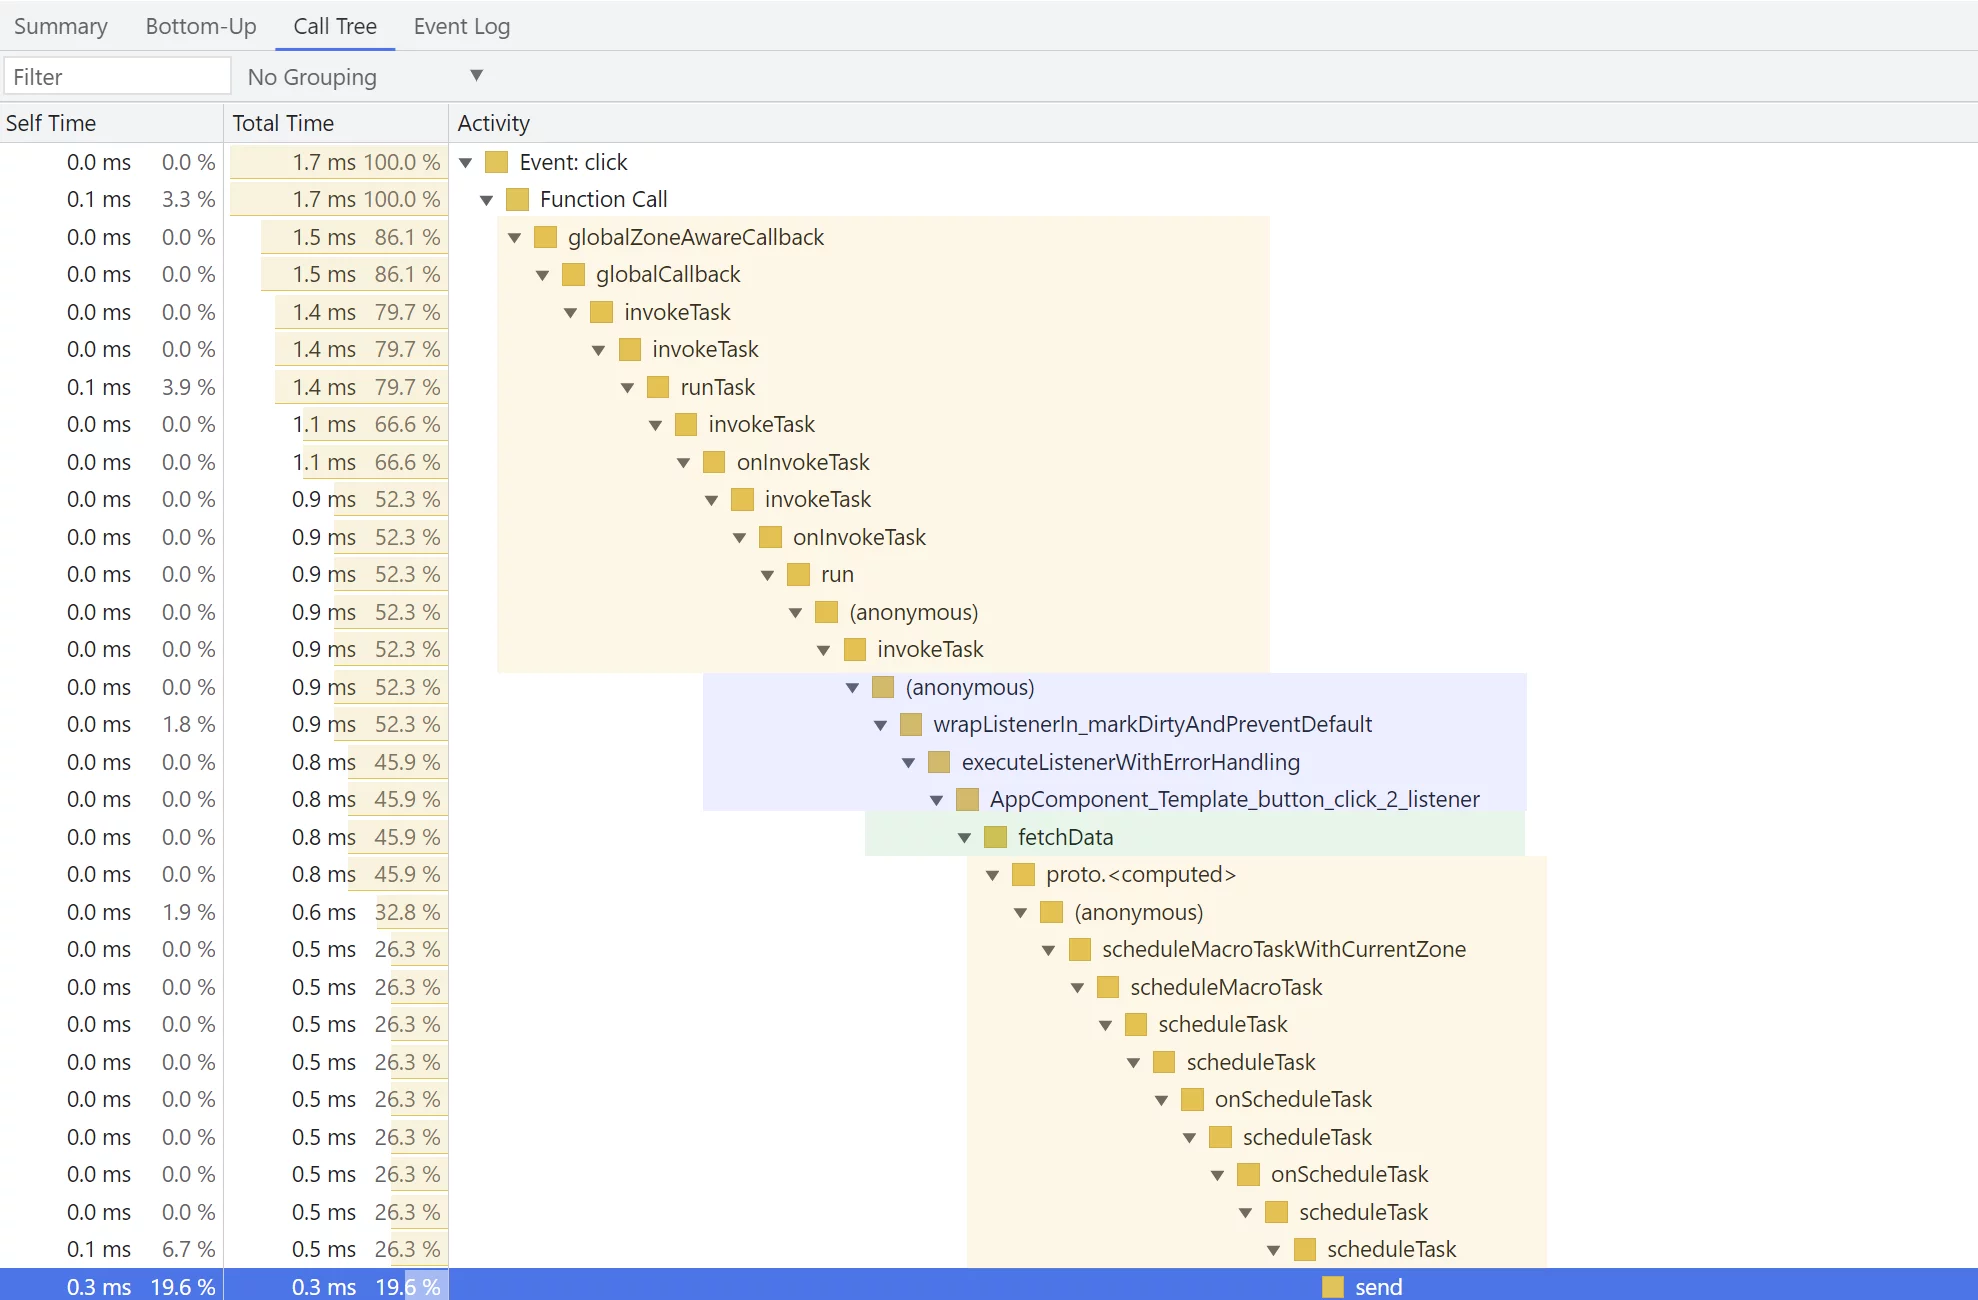
Here’s how I’ve color-coded the parts tied to each actor:
- yellow – zone.js
- purple – angular
- green – application
A different path in the call stack also reaches change detection:
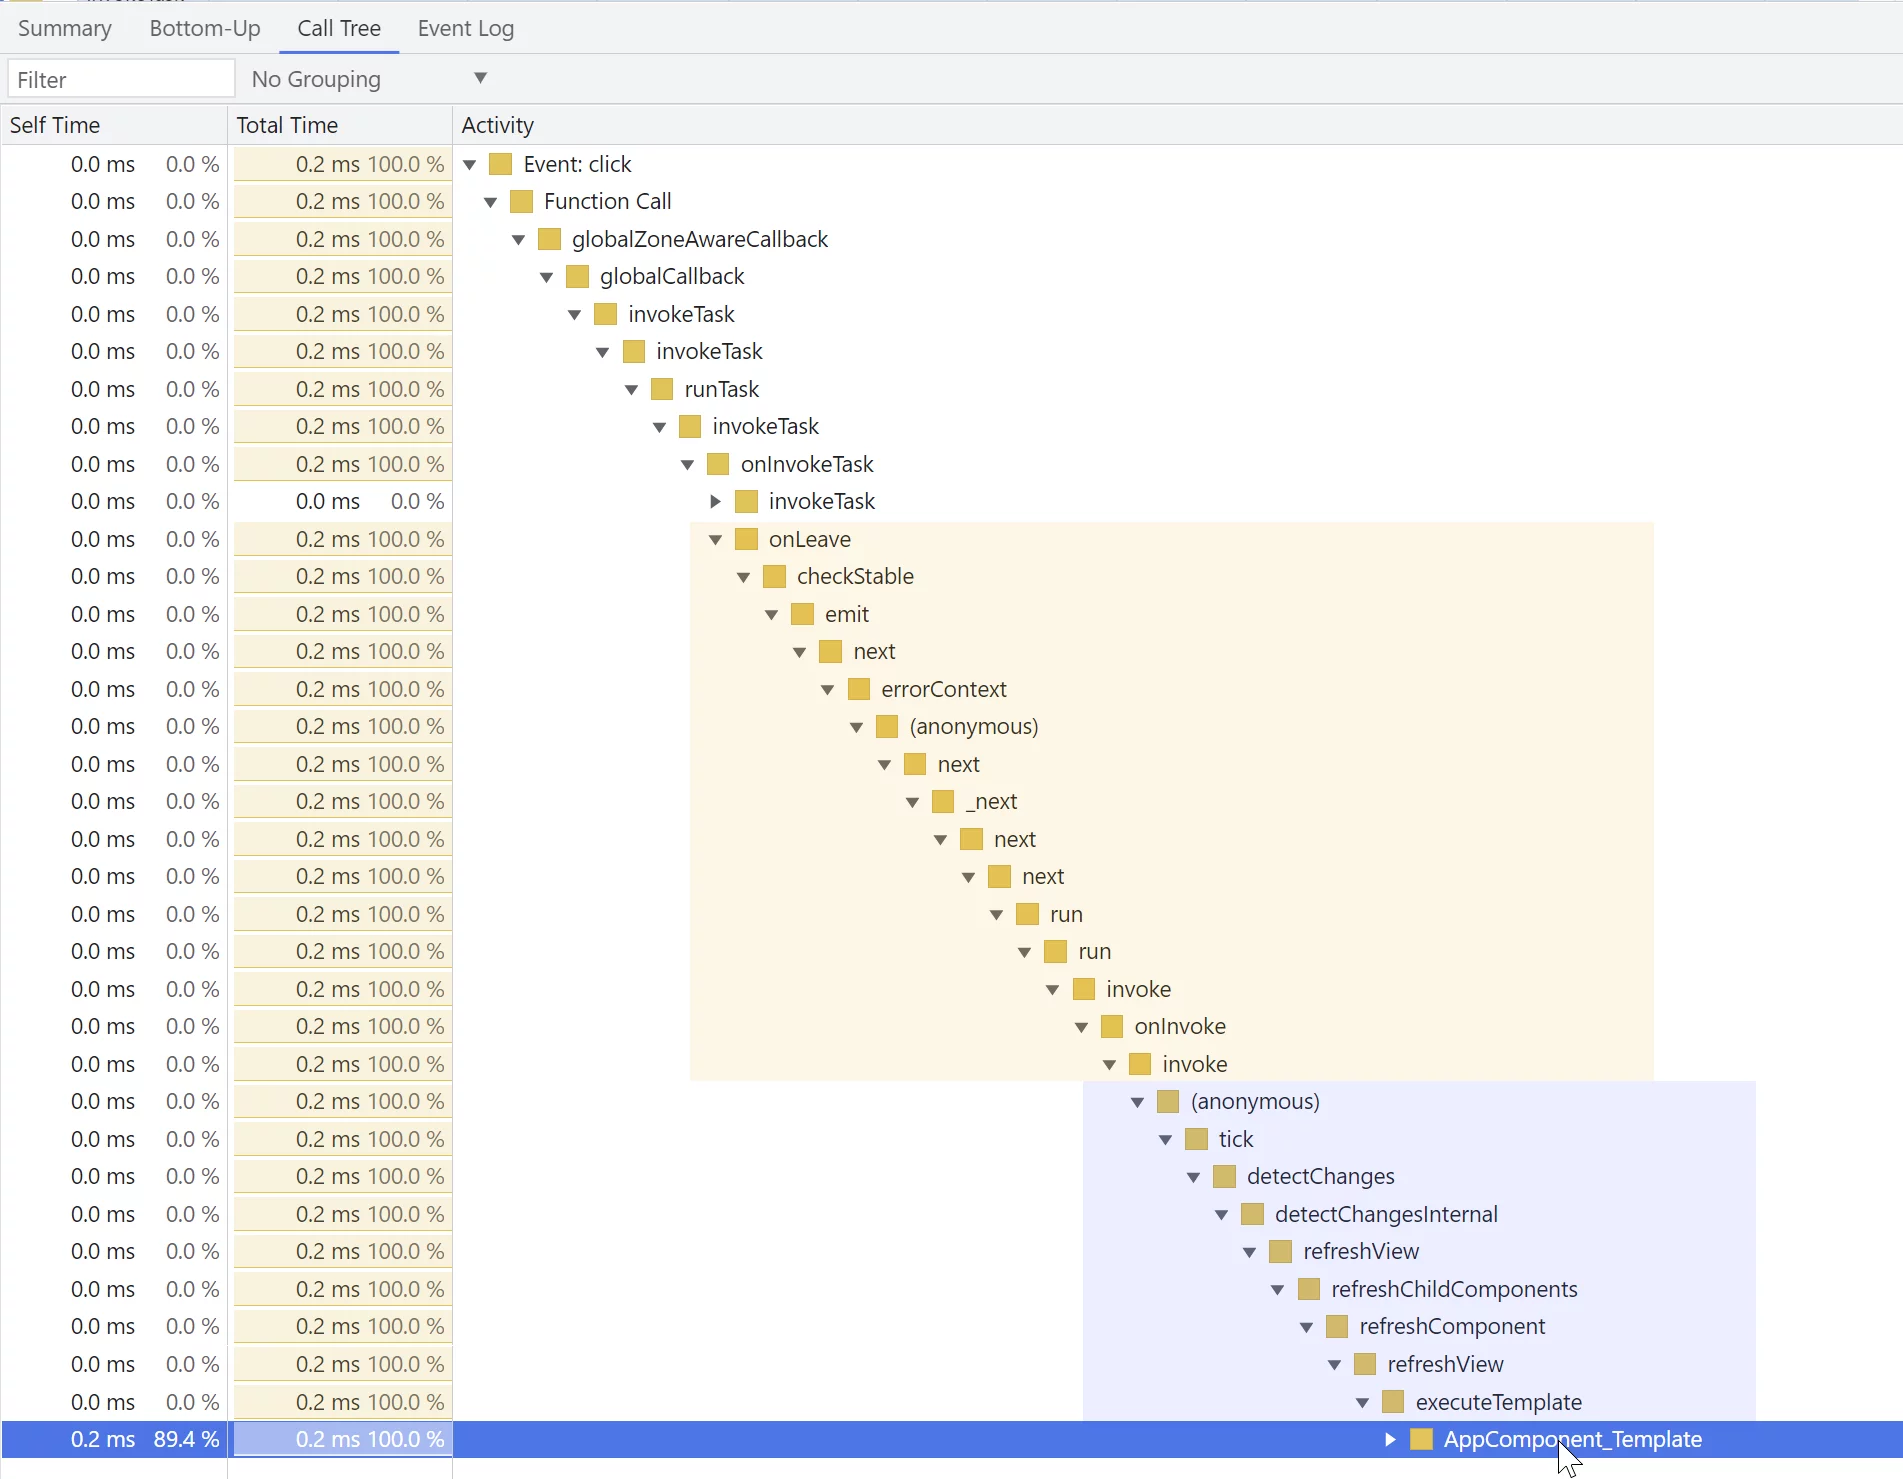
After Angular finishes checking for changes, the browser takes over and executes its rendering steps, including style recalculations, layout, painting, and optionally compositing:

One scenario worth examining is using setTimeout to delay until change detection completes.
Let’s dive into that.
Using setTimeout with change detection
In application code, you’ll frequently encounter setTimeout being called.
Suppose the goal is to display an input field and instantly place focus on it the moment a user presses a button.
Here’s an approach that achieves that:
import { Component } from '@angular/core';

@Component({
  selector: 'b-cmp',
  template: `
    Add a new todo:
    <button (click)="showSearchInput(ctrl)">Add</button>
    <div [hidden]="searchInputHidden">
      <input #ctrl />
    </div>
  `,
})
export class B {
  searchInputHidden = true;

  showSearchInput(ctrl) {
    this.searchInputHidden = false;

    setTimeout(function () {
      ctrl.focus();
    });
  }
}
Here’s how it looks:
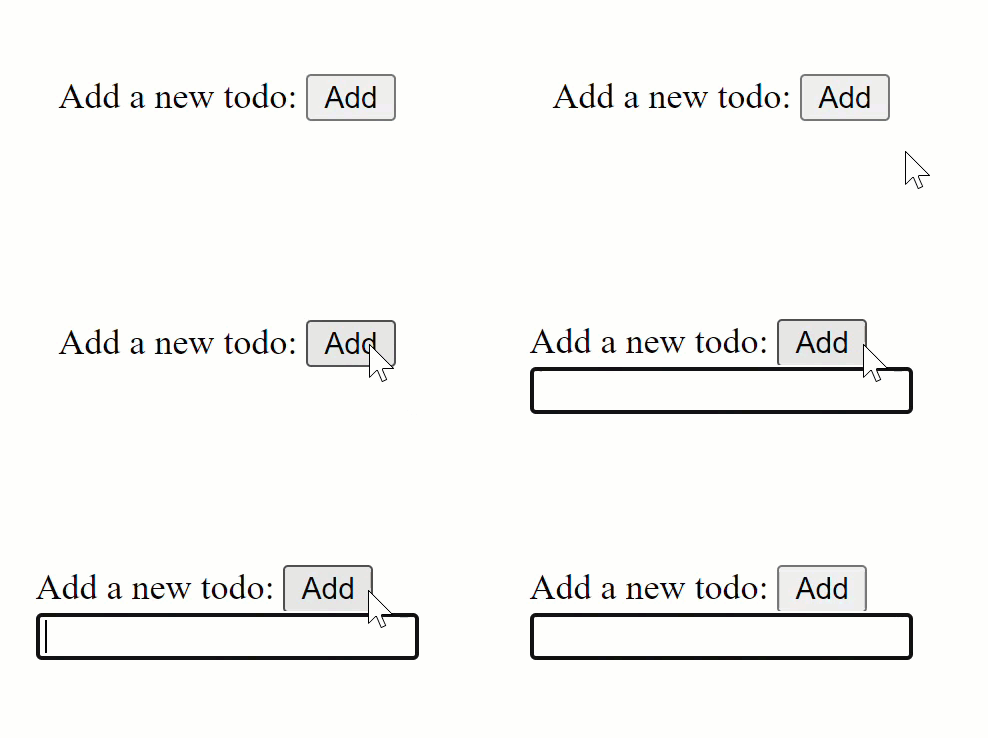
The implementation itself is quite simple. The user input triggers a response in the app, Angular performs change detection, and the component state gets refreshed. Angular then carries out its detecting logic and refreshes the DOM.
But why is setTimeout necessary here?
The delay is essential since you cannot call focus() on an element that remains hidden. Before Angular change detection gets a chance to execute (which occurs only after showSearchInput() completes), the hidden attribute in the DOM stays unchanged, despite having set searchInputHidden to false inside your function.
Calling setTimeout() with 0 milliseconds (or omitting the delay, which defaults to roughly 4ms) queues up a macrotask that executes once Angular has had the opportunity to run change detection and refresh the hidden property.
Additionally, once that setTimeout() callback wraps up, change detection fires again (since Angular patches every setTimeout() invocation within the Angular zone). Because our async callback only modifies focus, we can optimize by running it outside the Angular zone, thereby skipping that extra round of change detection:
import { Component } from '@angular/core';

@Component({
  selector: 'b-cmp',
  template: `
    Add a new todo:
    <button (click)="showSearchInput(ctrl)">Add</button>
    <div [hidden]="searchInputHidden">
      <input #ctrl />
    </div>
  `,
})
export class B {
  searchInputHidden = true;

  private showSearchInput(ctrl) {
    this.searchInputHidden = false;

    this._ngZone.runOutsideAngular(() => {
      setTimeout(() => ctrl.focus());
    });
  }
}
Keep in mind that for the previous snippet to function, you must inject NgZone into your constructor.
import { NgZone } from '@angular/core';

export class B {
  constructor(private _ngZone: NgZone) {}
}
Well, that’s it.