
Mapping the bundle pipeline
Before we dive into the details, it helps to see the full picture. Bundling in webpack is not a single pass — it's a sequence of connected stages, each with its own responsibilities. The diagram below gives a high-level view of that flow, even though some parts are intentionally simplified for now.
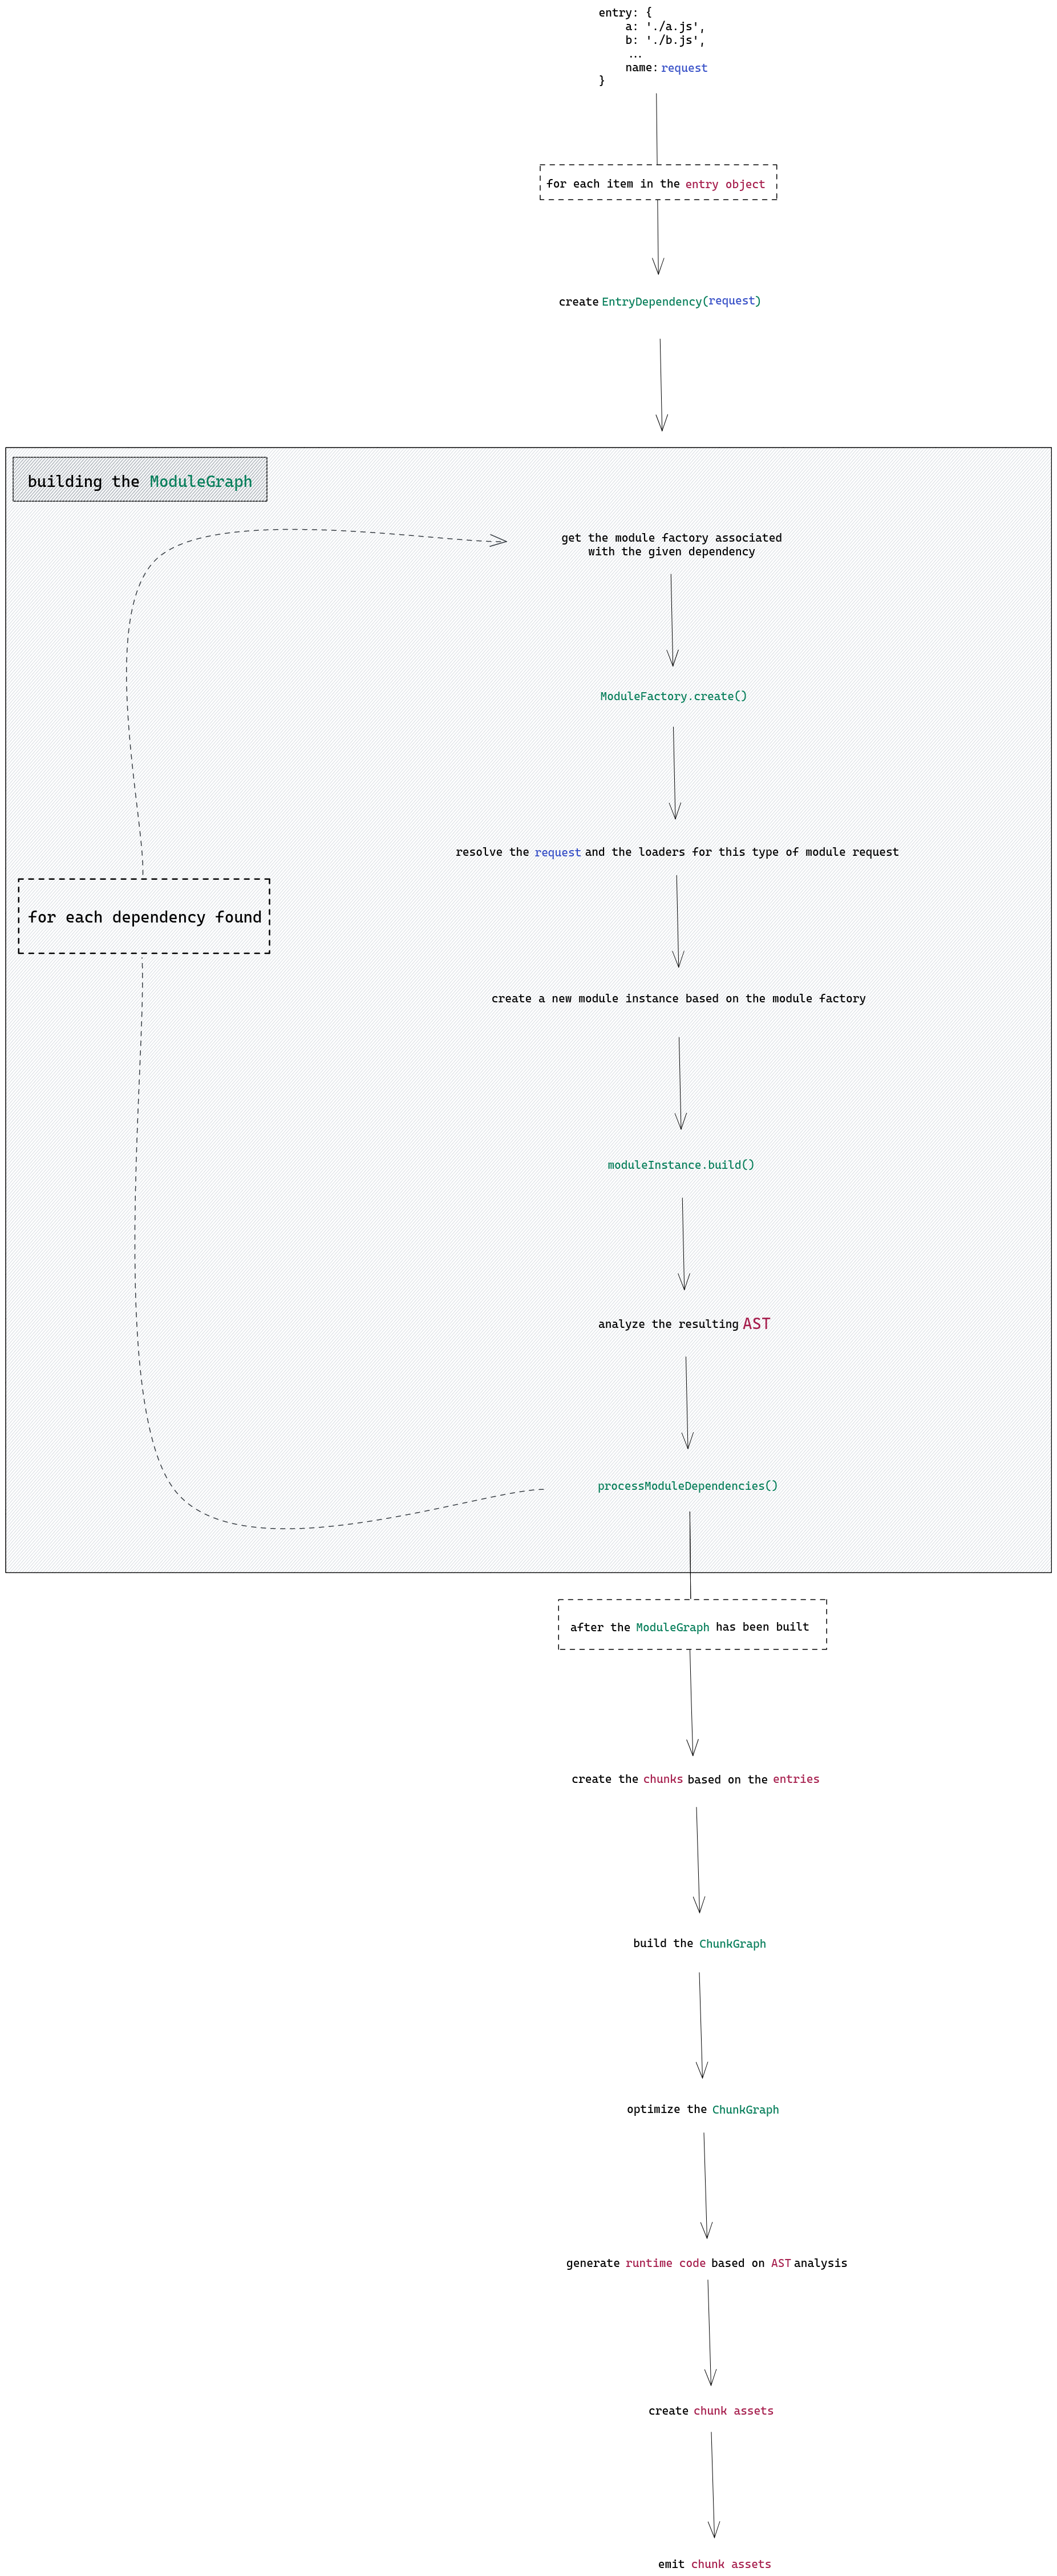
You can interact with the diagram in Excalidraw. Open it here.
I highly recommend keeping that Excalidraw link handy, because the rest of this article walks through each step of the diagram in more detail. You'll find that each section below expands on one or more of those steps.
Let’s get into it.
The entry object
Everything begins with the entry object. It accepts a variety of shapes and configurations, enough to fill its own article, so here we’ll stick to a simple case: a plain collection of key-value pairs. Each key is a bundle name, and each value is a path to a file.
// webpack.config.js
entry: {
	a: './a.js',
	b: './b.js',
	/* ... */
}
Conceptually, a module in webpack is associated with a file. In the diagram, 'a.js' becomes one module, and 'b.js' becomes another. For now, the key idea is that a module is an enriched version of a file. Once created and processed, a module carries much more than raw source code — it holds information about the loaders applied, its dependencies, its exports, its hash, and other metadata. Each entry in the entry object can be seen as the root module of its own module tree. That tree grows because the root module can pull in other modules (often called dependencies), which in turn may pull in more, and so on. All of these module trees are collected into a single structure called the ModuleGraph, covered in the next section.
Another thing worth noting is that webpack is heavily plugin-driven. The core bundling flow is fixed, but there are many points where custom logic can be inserted. This extensibility is built on hooks. For example, you can run custom code after the ModuleGraph is assembled, when a chunk gets a new asset, or just before a module is built (which involves running loaders and parsing the source). We'll explore these hooks in later articles, as they offer a lot of flexibility when customizing webpack. Plugins are organized around specific purposes, and each purpose usually has a dedicated plugin. Consider import() — there's a plugin called [ImportParserPlugin](https://github.com/webpack/webpack/blob/main/lib/dependencies/ImportParserPlugin.js#L27) that handles parsing the arguments and comments of an import() call during AST traversal.
It should come as no surprise that the entry object also has plugins dedicated to it. The EntryOptionPlugin reads the entry object and creates an EntryPlugin for each item in it. This is related to what we mentioned earlier: each entry item becomes the root of its own module tree, and those trees are kept separate. The EntryPlugin triggers the creation of one such tree, and each tree contributes to the same shared ModuleGraph. In informal terms, the EntryPlugin initiates that complex process.
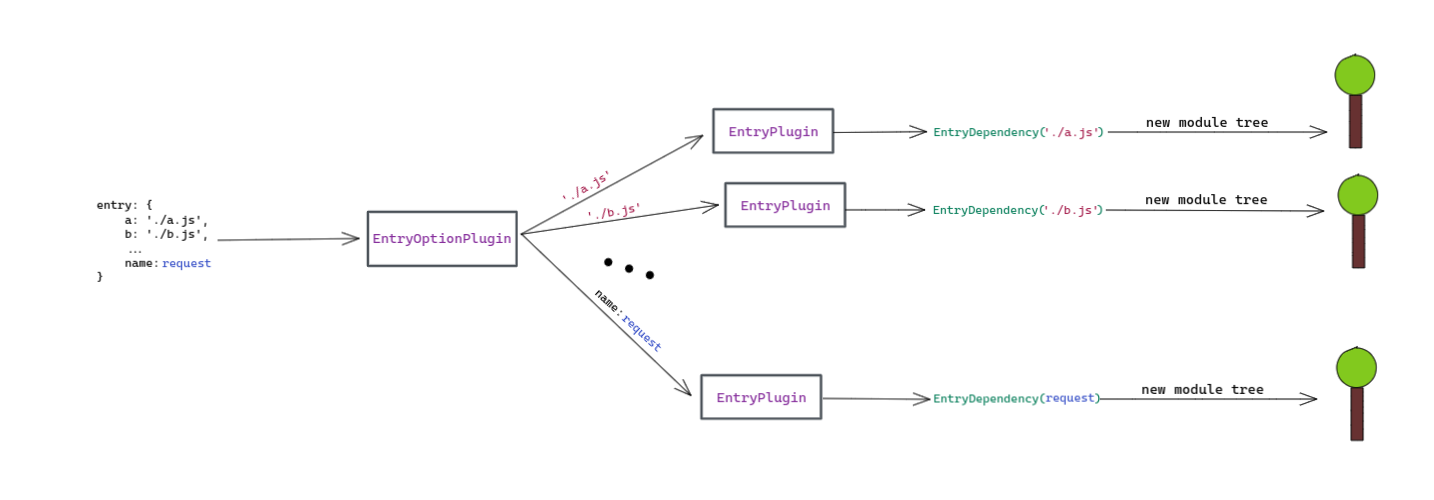
Keeping with the initial diagram, it's worth pointing out that the EntryPlugin also creates an EntryDependency as part of its job.
To see how important the EntryOptionPlugin is, let's sketch a simplified version of it ourselves:
class CustomEntryOptionPlugin {
  // This is the standard way of creating plugins.
  // It's either this, or a simple function, but we're using this approach
  // in order to be on par with how most of the plugins are created.
  apply(compiler) {
    // Recall that hooks offer us the possibility to intervene in the
    // bundling process.
    // With the help of the `entryOption` hook, we're adding the logic
    // that will basically mean the start of the bundling process. As in,
    // the `entryObject` argument will hold the `entry` object from the
    // configuration file and we'll be using it to set up the creation of
    // module trees.
    compiler.hooks.entryOption.tap('CustomEntryOptionPlugin', entryObject => {
      // The `EntryOption` class will handle the creation of a module tree.
      const EntryOption = class {
        constructor (options) {
          this.options = options;
        };

        // Since this is still a plugin, we're abiding by the standard.
        apply(compiler) {
          // The `start` hook marks the start of the bundling process.
          // It will be called **after** `hooks.entryOption` is called.
          compiler.hooks.start('EntryOption', ({ createModuleTree }) => {
            // Creating new tree of modules, based on the configuration of this plugin.
            // The `options` contain the name of the entry(which essentially is the name of the chunk)
            // and the file name.
            // The `EntryDependency` encapsulates these options and also provides way to
            // create modules(because it maps to a `NormalModuleFactory`, which produces `NormalModule`s).
            // After calling `createModuleTree`, the source code of the file will be found,
            // then a module instance will be created and then webpack will get its AST, which
            // will be further used in the bundling process.
            createModuleTree(new EntryDependency(this.options));
          });
        };
      };

      // For each item in the `entryObject` we're preparing
      // the creation of a module tree. Remember that each
      // module tree is independent of others.
			// The `entryObject` could be something like this: `{ a: './a.js' }`
      for (const name in entryObject) {
        const fileName = entryObject[name];
        // We're fundamentally saying: `ok webpack, when the bundling process starts,
        // be ready to create a module tree for this entry`.
        new EntryOption({ name, fileName }).apply(compiler);
      };
    });
  }
};
Before wrapping up this section, let's clarify what a Dependency is, since it will show up again later in this article and in future ones. You might be asking: what is an EntryDependency and why is it necessary? From my viewpoint, this comes down to a smart abstraction for creating modules. A dependency is essentially a precursor to an actual module. Even the items in the entry object are treated as dependencies — they carry just enough information to create a module, namely its path (like ./a.js or ./b.js). Without a dependency, a module can’t be created, because the dependency holds the module's request — meaning the path to the source file (e.g., './a.js'). A dependency also specifies how to build the module, and it does this by referencing a module factory. A module factory knows how to transform a raw input, like a string of source code, into a full-fledged module that webpack can use. The EntryDependency is a specific kind of [ModuleDependency](https://github.com/webpack/webpack/blob/main/lib/dependencies/ModuleDependency.js#L16), so it inevitably contains the module's request, and its associated factory is NormalModuleFactory. That factory knows how to turn a path into something meaningful for webpack. Another way to think about it: a module starts as a mere path (from the entry object or an import statement), becomes a dependency, and finally ends up as a module.
Here's a visual summary:
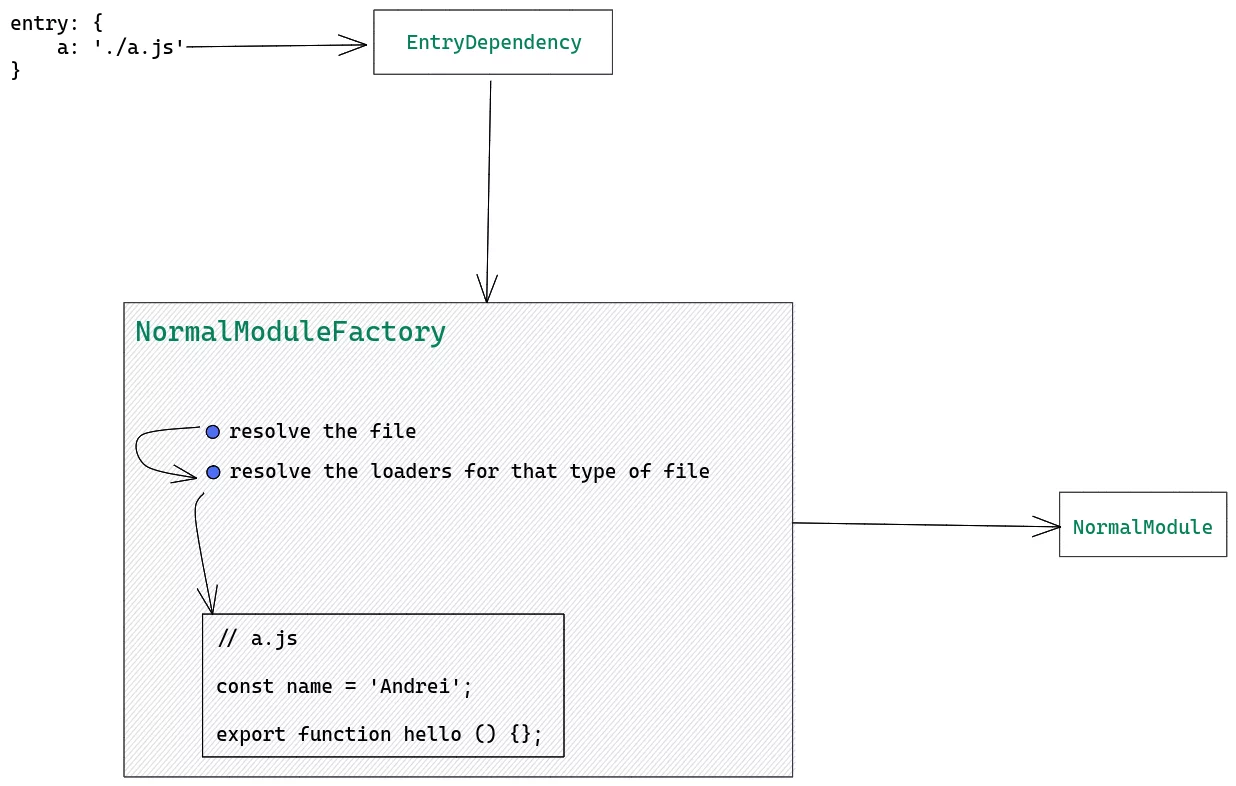
The same diagram is available in Excalidraw — check it out here.
So, the EntryDependency is used right at the start, when the root module of the tree is being created.
Other modules rely on different types of dependencies. For instance, an import statement like import defaultFn from './a.js' generates a HarmonyImportSideEffectDependency, which holds the module's request (in this case, './a.js') and also references the NormalModuleFactory. That results in a new module for 'a.js'. Hopefully this makes the role of dependencies clearer — they essentially instruct webpack on how to construct modules. We’ll dig deeper into dependencies later.
To recap this section: every item in the entry object spawns an EntryPlugin, which creates an EntryDependency. This dependency contains the module's request (the file path) and delegates to a module factory, specifically NormalModuleFactory, to turn that request into a usable module. A dependency is therefore essential for module creation, as it carries crucial details like the request and the method for processing it. Not all dependencies lead to new modules, however. From each EntryPlugin, with the help of the EntryDependency, a module tree is formed — built from modules and their own dependencies, which can themselves have further dependencies.
With that foundation, let’s move on to the ModuleGraph.
Examining the ModuleGraph
The ModuleGraph serves as a registry for built modules. Its functionality depends on dependencies, which act as the links between pairs of modules. Consider this scenario:
// a.js
import defaultBFn from '.b.js/';

// b.js
export default function () { console.log('Hello from B!'); }
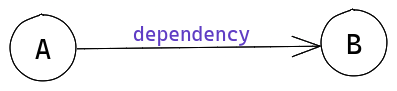
In this case, we have two files, meaning two modules. Since file a imports something from file b, an import statement establishes a dependency within a. From the perspective of the ModuleGraph, a dependency simply defines a relationship between two modules. Even the EntryDependency mentioned earlier connects two modules: the graph's root, which we'll call the null module, and the module that corresponds to the entry file. The illustration above can be represented as follows:
It's worth distinguishing between a plain module (i.e., a NormalModule instance) and one that is part of the ModuleGraph. A node within the ModuleGraph is known as a [ModuleGraphModule](https://github.com/webpack/webpack/blob/main/lib/ModuleGraph.js#L60) and is essentially a decorated NormalModule. The ModuleGraph manages these decorated modules using a map with the signature Map<Module, ModuleGraphModule>. This distinction matters because a set of NormalModule instances on their own is fairly limited — they lack the ability to interact. The ModuleGraph gives these standalone modules purpose by linking them through the map, which pairs each NormalModule with a corresponding ModuleGraphModule. This will become clearer by the end of the Building the ModuleGraph section, where we'll leverage the ModuleGraph and its internal map to navigate the graph. For simplicity, we'll refer to any module within the ModuleGraph as just module, since the difference boils down to a handful of extra properties.
For each node in the ModuleGraph, two key things are defined: the incoming connections and the outgoing connections. A connection is another compact structure within the ModuleGraph that carries important data: the origin module, the destination module, and the dependency that ties these two together. In the diagram above, for instance, a new connection would be established:
// This is based on the diagram and the snippet from above.
Connection: {
	originModule: A,
	destinationModule: B,
	dependency: ImportDependency
}
This connection then gets added to the A.outgoingConnections set, while also being registered in the B.incomingConnections set.
These are the fundamental building blocks of the ModuleGraph. As noted in the prior section, the module trees generated from each entry all funnel their information into this single shared structure. That's because every tree will ultimately link back to the null module (the ModuleGraph's root). The connection to this null module is forged via the EntryDependency and the module derived from the entry file. Here's a mental model I like for the ModuleGraph:
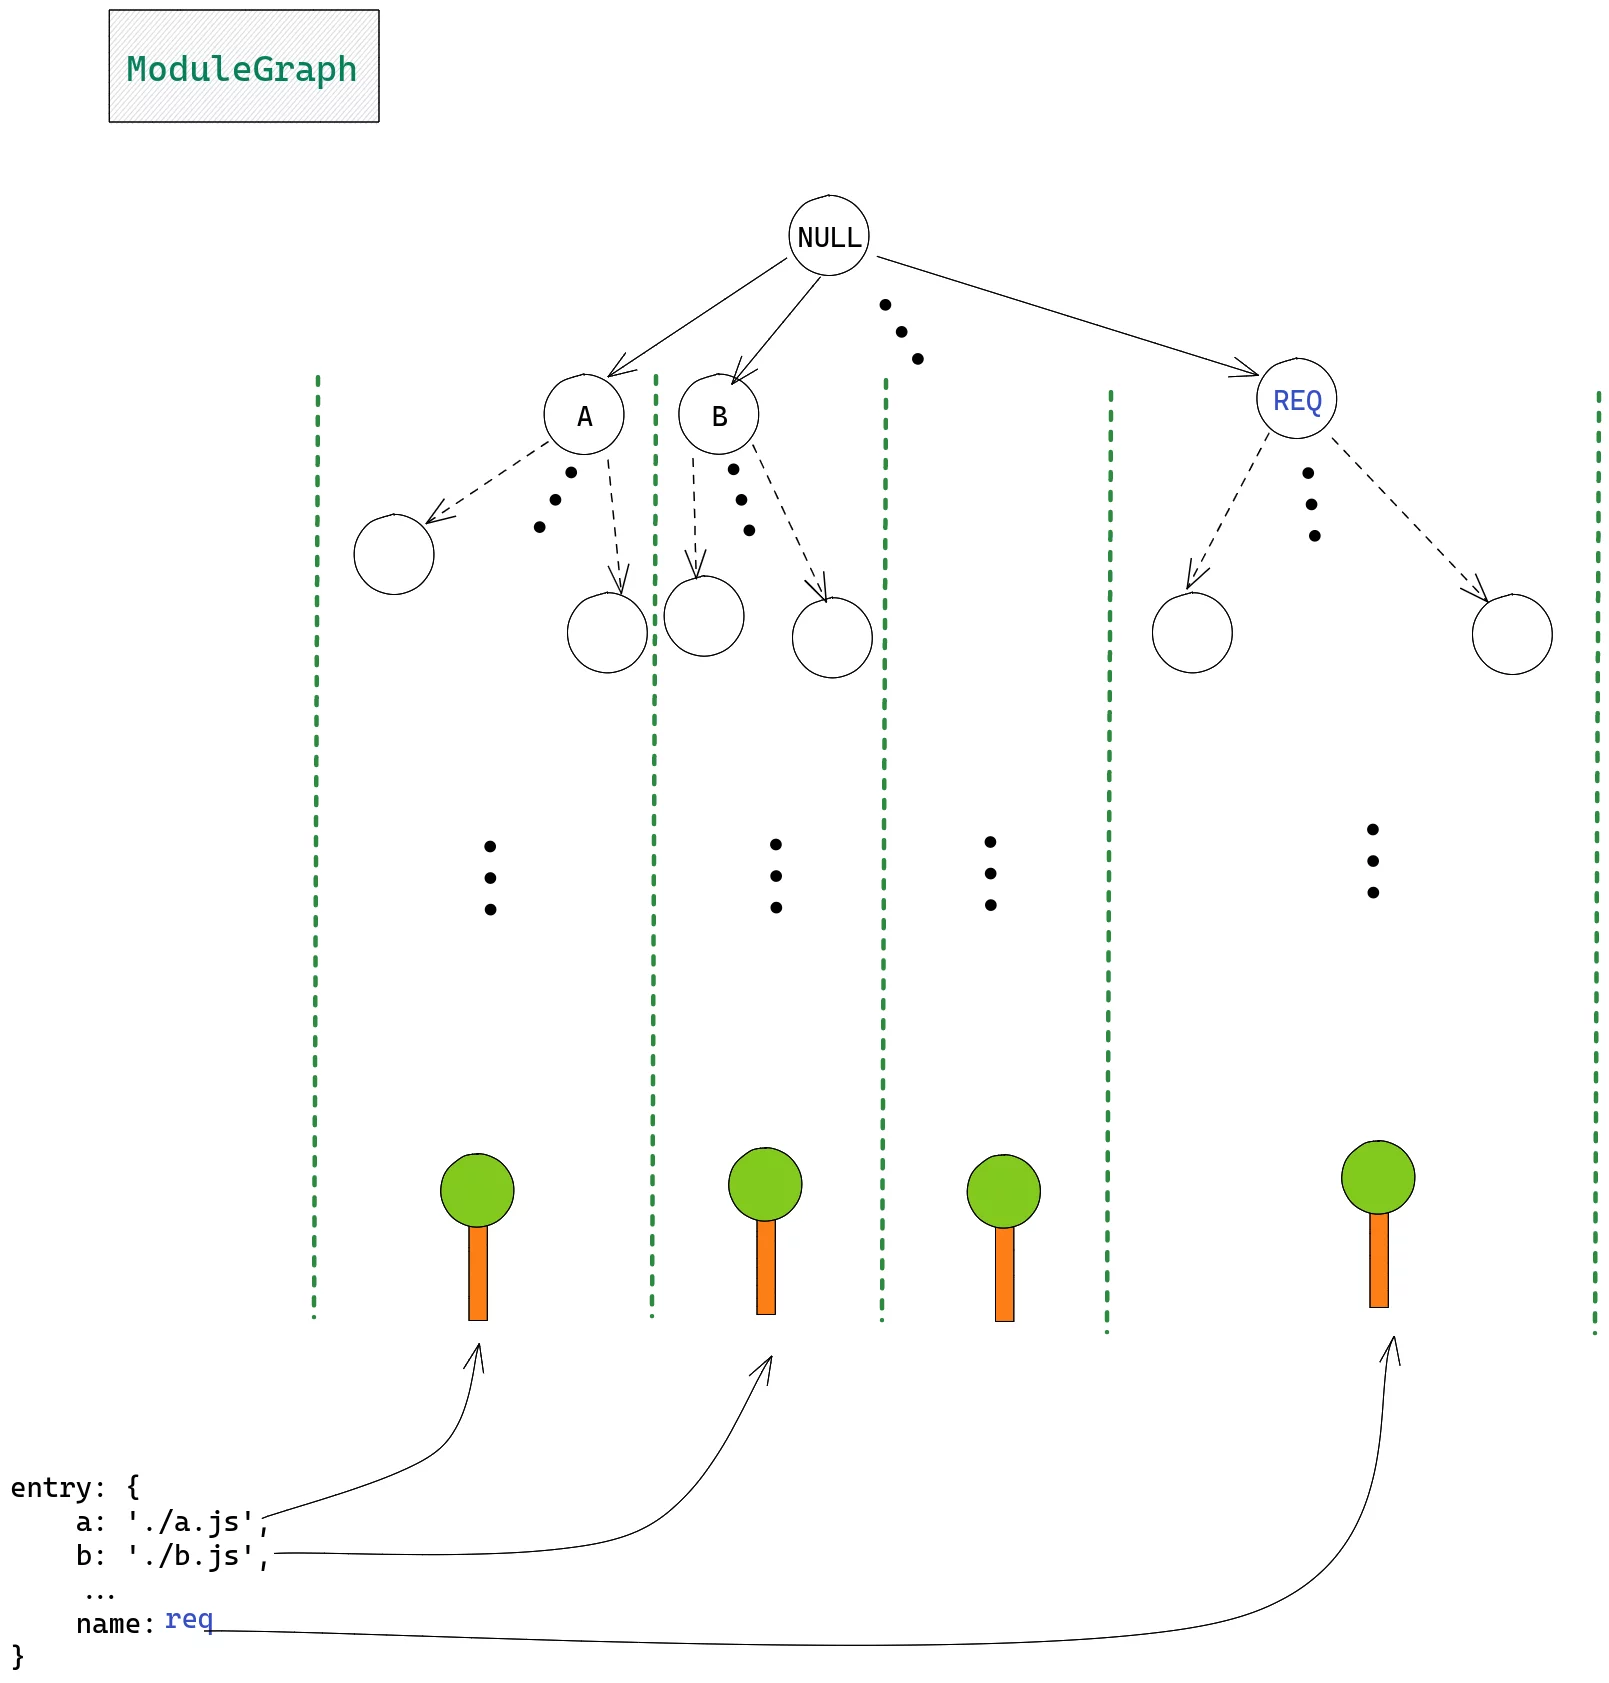
Here is the Excalidraw link for the above diagram. Note: this diagram is not based on a previous example.
As illustrated, the null module maintains a connection to the root module of every tree spawned from an item in the entry object. Each edge in the graph signifies a connection between two modules, and each connection records the source, destination, and the dependency (which answers, in essence, what's the reason for this link?).
With a clearer picture of the ModuleGraph in mind, let's explore how it comes together.
Constructing the ModuleGraph
As outlined previously, the ModuleGraph begins with a null module whose immediate children are the root modules of the trees formed from the entry items. To grasp the building process, we'll focus on how a single module tree is assembled.
Starting points: the initial modules
Let's begin with a basic entry configuration:
entry: {
	a: './a.js',
}
Following the logic from the first section, we'd eventually arrive at an EntryDependency whose request is './a.js'. This EntryDependency is the key to creating something tangible from that request, as it links to a module factory, specifically NormalModuleFactory. That's precisely where we paused in the earlier section.
Now, the NormalModuleFactory takes center stage. If all goes well, it produces a NormalModule.
To be clear, a NormalModule is essentially a deserialized representation of a file's source, which is just a raw string at its core. A bare string isn't very useful on its own, so webpack needs more context. The NormalModule stores that string but also packs in additional metadata and behavior, such as the loaders applied, the logic for building, runtime code generation, its hash, and more. In short, the NormalModule is webpack's functional interpretation of a raw file.
Getting from the NormalModuleFactory to a finished NormalModule involves several phases. There's also post-creation work, like building the module and handling any dependencies it may have.
Let's revisit the overarching diagram, zooming in on the Building the ModuleGraph segment:
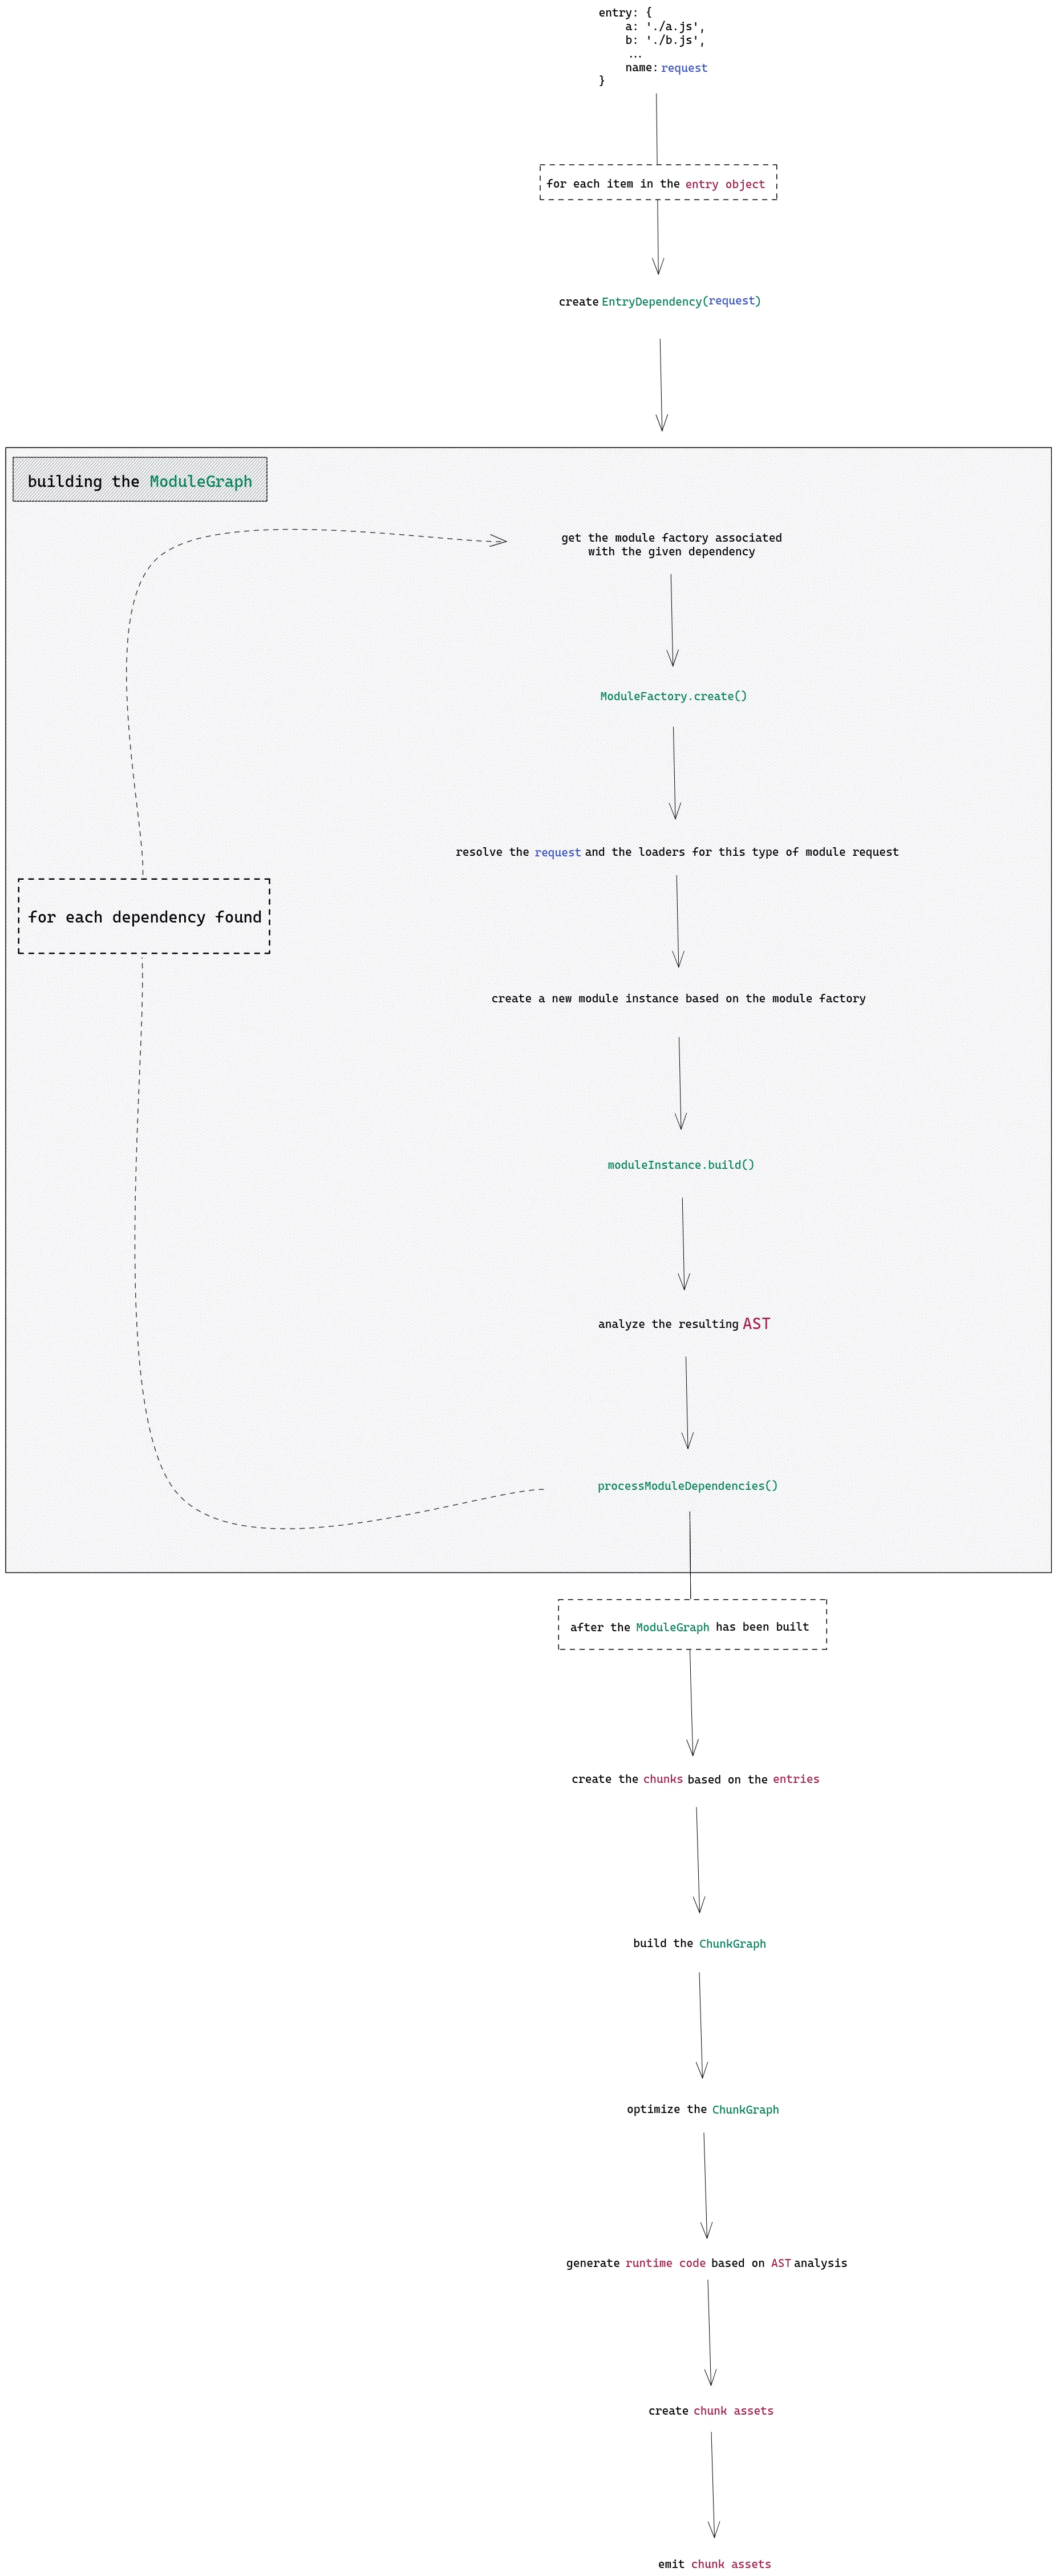
The diagram's link is available here.
The NormalModuleFactory kicks off by calling its create method. This triggers the resolution phase, where the request (the file path) is resolved, along with any relevant loaders for that file type. Note that only the loader paths are figured out here; the loaders aren't executed yet.
The module's build process
Once all paths are resolved, the NormalModule is instantiated. But at this juncture, it's still fairly bare. Valuable details emerge only after the build phase. The build process for a NormalModule involves a few key steps:
- loaders are applied to the source in sequence; when multiple loaders are present, the output of one feeds into the next (and the order in the config matters);
- the transformed string, after passing through all loaders, is parsed by acorn (a JS parser) to generate the AST;
- the AST is then examined; this step is crucial because it uncovers the module's dependencies (e.g., other modules), and webpack can spot special constructs like
require.contextormodule.hot; this analysis happens in the[JavascriptParser](https://github.com/webpack/webpack/blob/main/lib/javascript/JavascriptParser.js#L151), which handles a variety of cases — click the link to see; this is arguably the most pivotal stage, as much of what follows depends on it;
Uncovering dependencies via the AST
Without going deep into the weeds, here's a high-level view of the discovery process:

A link to the diagram above is available here.
Here, moduleInstance denotes the NormalModule built from the index.js file. The red dep represents the dependency from the first import, while the blue dep corresponds to the second one. This is a simplified model; in practice, dependencies are recorded after the AST is generated.
With the AST inspected, we proceed to build the module tree we discussed earlier. The upcoming step is to process the dependencies identified in the previous phase. In the diagram above, the index module has two dependencies, math.js and utils.js. At this point, though, they're not yet full modules — the index module's module.dependencies holds two entries with info like the file request and import names (e.g., sum, greet). To convert them into modules, we rely on the ModuleFactory tied to each dependency and reiterate the steps outlined above (indicated by the dashed arrow in the earlier diagram). Once the current module's dependencies are processed, those may spawn their own, and the cycle continues until no further dependencies remain. This recursive approach builds out the module tree while ensuring parent-child connections are correctly established.
With this foundation, it's worth experimenting with the ModuleGraph ourselves. To that end, let's craft a custom plugin that traverses the ModuleGraph. The dependency structure is shown below:
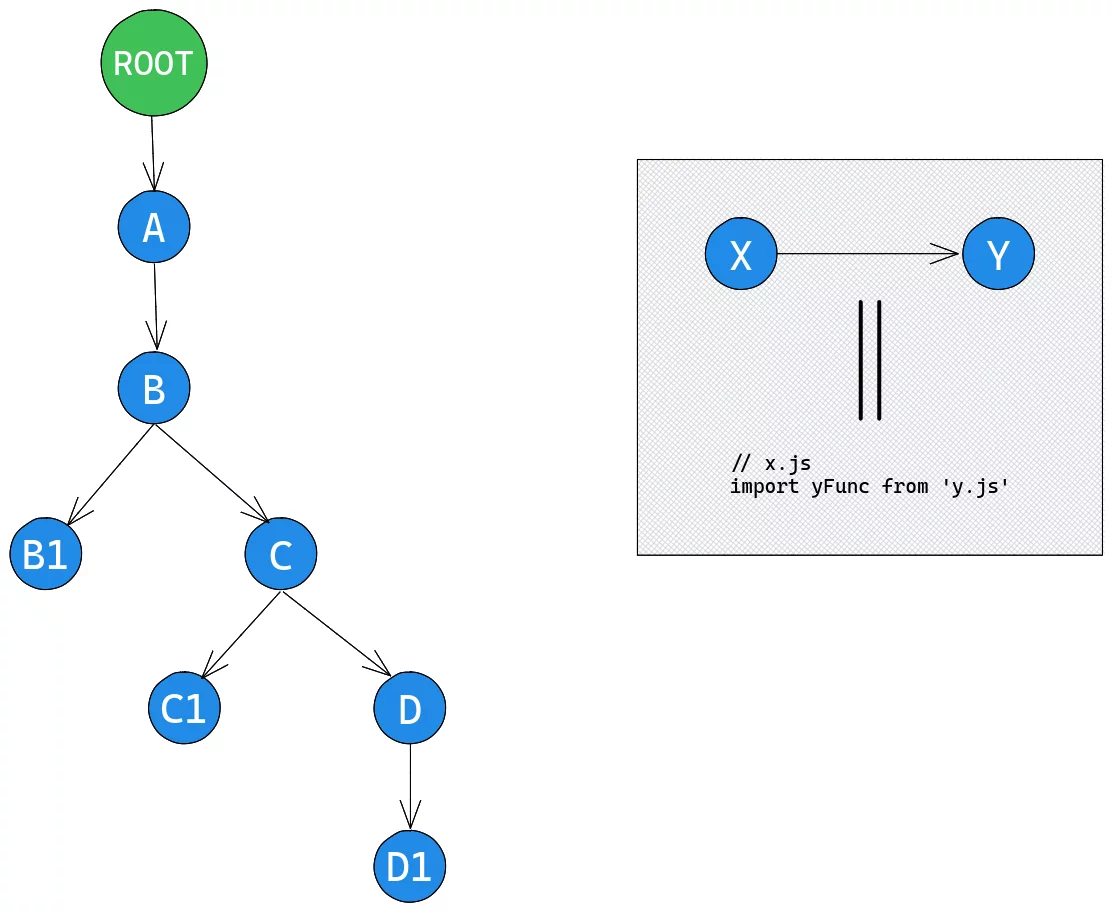
The link for the diagram above can be found here.
For clarity: a.js imports b.js, which imports both b1.js and c.js; c.js then imports c1.j and d.js; finally, d.js imports d1.js. ROOT points to the null module, the top of the ModuleGraph. The entry has a single value, a.js:
// webpack.config.js
const config = {
  entry: path.resolve(__dirname, './src/a.js'),
	/* ... */
};
Here's what the custom plugin might look like:
// The way we're adding logic to the existing webpack hooks
// is by using the `tap` method, which has this signature:
// `tap(string, callback)`
// where `string` is mainly for debugging purposes, indicating
// the source where the custom logic has been added from.
// The `callback`'s argument depend on the hook on which we're adding custom functionality.

class UnderstandingModuleGraphPlugin {
  apply(compiler) {
    const className = this.constructor.name;
    // Onto the `compilation` object: it is where most of the *state* of
    // the bundling process is kept. It contains information such as the module graph,
    // the chunk graph, the created chunks, the created modules, the generated assets
    // and much more.
    compiler.hooks.compilation.tap(className, (compilation) => {
      // The `finishModules` is called after *all* the modules(including
      // their dependencies and the dependencies' dependencies and so forth)
      // have been built.
      compilation.hooks.finishModules.tap(className, (modules) => {
        // `modules` is the set which contains all the built modules.
        // These are simple `NormalModule` instances. Once again, a `NormalModule`
        // is produced by the `NormalModuleFactory`.
        // console.log(modules);

        // Retrieving the **module map**(Map<Module, ModuleGraphModule>).
        // It contains all the information we need in order to traverse the graph.
        const {
          moduleGraph: { _moduleMap: moduleMap },
        } = compilation;

        // Let's traverse the module graph in a DFS fashion.
        const dfs = () => {
          // Recall that the root module of the `ModuleGraph` is the
          // *null module*.
          const root = null;

          const visited = new Map();

          const traverse = (crtNode) => {
            if (visited.get(crtNode)) {
              return;
            }
            visited.set(crtNode, true);

            console.log(
              crtNode?.resource ? path.basename(crtNode?.resource) : 'ROOT'
            );

            // Getting the associated `ModuleGraphModule`, which only has some extra
            // properties besides a `NormalModule` that we can use to traverse the graph further.
            const correspondingGraphModule = moduleMap.get(crtNode);

            // A `Connection`'s `originModule` is the where the arrow starts
            // and a `Connection`'s `module` is there the arrow ends.
            // So, the `module` of a `Connection` is a child node.
            // Here you can find more about the graph's connection: https://github.com/webpack/webpack/blob/main/lib/ModuleGraphConnection.js#L53.
            // `correspondingGraphModule.outgoingConnections` is either a Set or undefined(in case the node has no children).
            // We're using `new Set` because a module can be reference the same module through multiple connections.
            // For instance, an `import foo from 'file.js'` will result in 2 connections: one for a simple import
            // and one for the `foo` default specifier. This is an implementation detail which you shouldn't worry about.
            const children = new Set(
              Array.from(
                correspondingGraphModule.outgoingConnections || [],
                (c) => c.module
              )
            );
            for (const c of children) {
              traverse(c);
            }
          };

          // Starting the traversal.
          traverse(root);
        };

        dfs();
      });
    });
  }
}
The example is available in this StackBlitz app. Run npm run build to see it in action. Based on the hierarchy, here's the expected output after executing build:
a.js
b.js
b1.js
c.js
c1.js
d.js
d1.js
With the ModuleGraph fully built and hopefully clearer now, it's time to look at what comes next. Per the main diagram, the following stage is chunk creation. But first, let's clarify a few key terms: Chunk, ChunkGroup, and EntryPoint.
Understanding Chunk, ChunkGroup, and EntryPoint
With a clearer picture of what modules are, we can now layer on the next set of ideas. In short, a module is an enhanced version of a file. After being created and built, a module carries far more than just the source code — it holds information about the loaders applied to it, its dependencies, its exported members (if any), its hash, and other metadata.
Moving up the abstraction ladder, a Chunk is a container that holds one or more modules. It might be tempting to assume that the number of chunks in the output is directly tied to the number of items in the entry object, but that's not always the case. While it's true that every entry item produces a corresponding chunk in the dist folder, additional chunks can be created implicitly. A good example is using the import() function, which introduces new chunks on the fly. Nonetheless, no matter how a chunk originates, every chunk results in a file being written to the dist directory. We will revisit this in the Building the ChunkGraph section, where we'll clarify which modules are assigned to which chunks.
A ChunkGroup is an even higher-level construct that groups together one or more chunks. These groups can be linked in a hierarchy, meaning a ChunkGroup can act as a parent or a child to another ChunkGroup. For instance, whenever the import() function is used in a file, a new ChunkGroup is spawned, and its parent is the existing ChunkGroup that contains the module where the dynamic import resides. You'll see this parent-child relationship illustrated in the Building the ChunkGraph section.
Lastly, an EntryPoint is a specific kind of ChunkGroup, generated for each item in the entry object. Being part of an EntryPoint carries implications for how code is rendered, a topic we'll dig into in a later article.
With these concepts in hand, let's move on to understanding the ChunkGraph itself.
Constructing the ChunkGraph
Up to this point, we've only worked with the ModuleGraph, which we covered in an earlier section. However, the ModuleGraph is just one piece of the puzzle. To enable features like code splitting, webpack needs to build upon it.
At this stage of the bundling pipeline, each item in the entry object gets its own EntryPoint. Given that an EntryPoint is a type of ChunkGroup, it must contain at least one chunk. So, if your entry object defines three items, you'll have three EntryPoint instances, and each one will contain a chunk — commonly referred to as the entrypoint chunk — named after the key of the corresponding entry item. The modules that directly correspond to these entry files are called entry modules, and they are placed into their respective entrypoint chunk. These entry modules are crucial because they serve as the starting points for the entire ChunkGraph construction. It's worth noting that a single chunk can contain more than one entry module:
// webpack.config.js
entry: {
  foo: ['./a.js', './b.js'],
},
In the example above, the chunk named foo (named after the item's key) will contain two entry modules: one associated with a.js and another with b.js. Naturally, this chunk will be part of the EntryPoint created from that specific entry item.
Before diving into the details, let's establish a concrete example that we'll reference throughout this discussion:
entry: {
    foo: [path.join(__dirname, 'src', 'a.js'), path.join(__dirname, 'src', 'a1.js')],
    bar: path.join(__dirname, 'src', 'c.js'),
  },
This example brings together everything we've talked about: the parent-child relationships between ChunkGroups (via dynamic imports), the chunks themselves, and the EntryPoints.
You can run this example yourself on StackBlitz. The following diagram is based on this very setup.
The ChunkGraph is assembled recursively. The process kicks off by adding all entry modules to a queue. When an entry module is processed, its dependencies (which are also modules) are examined, and each of those dependencies is then added to the same queue. This cycle repeats until the queue is empty. During this phase, modules are visited. But this is only the first half of the story. Recall that ChunkGroups can have parent-child links. These connections are resolved in the second phase. For example, as mentioned earlier, a dynamic import() creates a new child ChunkGroup. In webpack's terminology, the import() expression defines an asynchronous block of dependencies. I think of it as a block because it's essentially a container that holds other objects. With something like import('./foo.js').then(module => ...), it's clear that we're intentionally loading code asynchronously. And to use the module variable, all dependencies of foo (including foo itself) must be fully resolved before the module becomes available. We'll explore how the import() function works in depth, including magic comments and other options, in a dedicated future article.
If you're curious, the block is created during AST analysis — you can see that here.
The main code that orchestrates the ChunkGraph construction is available here.
For now, let's look at the diagram of the ChunkGraph that results from our example configuration:

You can view an interactive version of this diagram on Excalidraw.
The diagram shows a simplified version of the ChunkGraph, but it's enough to highlight the resulting chunks and the connections between ChunkGroups. We can see four chunks, which means four output files. The foo chunk contains four modules, two of which are entry modules. The bar chunk has only one entry module, while the other module is considered a regular module. Additionally, each import() expression leads to a new ChunkGroup (with the bar EntryPoint as its parent), which in turn introduces a new chunk.
Because the content of the output files is determined by the ChunkGraph, this structure is absolutely critical to the entire bundling process. We'll touch on the chunk assets (the actual files produced) in the next section.
Before we get to a hands-on example using the ChunkGraph, there are a couple of important details to mention. Just like in the ModuleGraph, a node within the ChunkGraph is referred to as a ChunkGraphChunk (conceptually, a chunk that lives inside the ChunkGraph). This is essentially a decorated chunk, meaning it carries additional properties like the modules that belong to it, its entry modules, and so on. Similar to the ModuleGraph, the ChunkGraph stores these enriched chunks in a map with the signature WeakMap<Chunk, ChunkGraphChunk>. One key difference from the ModuleGraph is that this map doesn't track connections between chunks. Instead, all relevant information — such as which ChunkGroups a chunk belongs to — is stored directly on the chunk. Remember that chunks are bundled into ChunkGroups, and these groups can have parent-child relationships (as shown in the diagram). This is different from modules, which can depend on one another without a strict concept of parent modules.
Let's now see the ChunkGraph in action inside a custom plugin to make things more tangible. We'll use the same example as in the diagram above:
const path = require('path');

// We're printing this way in order to highlight the parent-child
// relationships between `ChunkGroup`s.
const printWithLeftPadding = (message, paddingLength) => console.log(message.padStart(message.length + paddingLength));

class UnderstandingChunkGraphPlugin {
  apply (compiler) {
    const className = this.constructor.name;
    compiler.hooks.compilation.tap(className, compilation => {
      // The `afterChunks` hook is called after the `ChunkGraph` has been built.
      compilation.hooks.afterChunks.tap(className, chunks => {
        // `chunks` is a set of all created chunks. The chunks are added into
        // this set based on the order in which they are created.
        // console.log(chunks);

        // As we've said earlier in the article, the `compilation` object
        // contains the state of the bundling process. Here we can also find
        // all the `ChunkGroup`s(including the `Entrypoint` instances) that have been created.
        // console.log(compilation.chunkGroups);

        // An `EntryPoint` is a type of `ChunkGroup` which is created for each
        // item in the `entry` object. In our current example, there are 2.
        // So, in order to traverse the `ChunkGraph`, we will have to start
        // from the `EntryPoints`, which are stored in the `compilation` object.
        // More about the `entrypoints` map(<string, Entrypoint>): https://github.com/webpack/webpack/blob/main/lib/Compilation.js#L956-L957
        const { entrypoints } = compilation;

        // More about the `chunkMap`(<Chunk, ChunkGraphChunk>): https://github.com/webpack/webpack/blob/main/lib/ChunkGraph.js#L226-L227
        const { chunkGraph: { _chunks: chunkMap } } = compilation;

        const printChunkGroupsInformation = (chunkGroup, paddingLength) => {
          printWithLeftPadding(`Current ChunkGroup's name: ${chunkGroup.name};`, paddingLength);
          printWithLeftPadding(`Is current ChunkGroup an EntryPoint? - ${chunkGroup.constructor.name === 'Entrypoint'}`, paddingLength);

          // `chunkGroup.chunks` - a `ChunkGroup` can contain one or mode chunks.
          const allModulesInChunkGroup = chunkGroup.chunks
            .flatMap(c => {
              // Using the information stored in the `ChunkGraph`
              // in order to get the modules contained by a single chunk.
              const associatedGraphChunk = chunkMap.get(c);

              // This includes the *entry modules* as well.
              // Using the spread operator because `.modules` is a Set in this case.
              return [...associatedGraphChunk.modules];
            })
            // The resource of a module is an absolute path and
            // we're only interested in the file name associated with
            // our module.
            .map(module => path.basename(module.resource));
          printWithLeftPadding(`The modules that belong to this chunk group: ${allModulesInChunkGroup.join(', ')}`, paddingLength);

          console.log('\n');

          // A `ChunkGroup` can have children `ChunkGroup`s.
          [...chunkGroup._children].forEach(childChunkGroup => printChunkGroupsInformation(childChunkGroup, paddingLength + 3));
        };

		// Traversing the `ChunkGraph` in a DFS manner.
        for (const [entryPointName, entryPoint] of entrypoints) {
          printChunkGroupsInformation(entryPoint, 0);
        }
      });
    });
  }
};
The full code is available in this StackBlitz app. After running npm run build, you should see output similar to this:
Current ChunkGroup's name: foo;
Is current ChunkGroup an EntryPoint? - true
The modules that belong to this chunk group: a.js, b.js, a1.js, b1.js

Current ChunkGroup's name: bar;
Is current ChunkGroup an EntryPoint? - true
The modules that belong to this chunk group: c.js, common.js

   Current ChunkGroup's name: c1;
   Is current ChunkGroup an EntryPoint? - false
   The modules that belong to this chunk group: c1.js

   Current ChunkGroup's name: c2;
   Is current ChunkGroup an EntryPoint? - false
   The modules that belong to this chunk group: c2.js
We've used indentation to make the parent-child relationships clear. The output aligns with what we saw in the diagram, confirming that our traversal logic is working correctly.
Emitting chunk assets
It's important to understand that the files written to the dist directory are not just direct copies of your source files. Webpack injects its own runtime code to make everything function as expected.
This raises the question: how does webpack know what code to generate? The answer starts at the module level. A module might export members, import from other modules, use dynamic imports, or rely on webpack-specific helpers like require.resolve. Based on what a module does in its source, webpack determines what output code is needed. This discovery happens during AST analysis, where dependencies are identified. Though we've used dependencies and modules somewhat interchangeably so far, the reality is more nuanced.
For instance, a plain import { aFunction } from './foo' statement generates two dependencies — one for the import itself and another for the specifier (aFunction) — but only one module is created. Another example is the import() function. As we discussed earlier, this creates an asynchronous block of dependencies, one of which is the ImportDependency, specific to dynamic imports.
These dependencies play a pivotal role because they carry certain signals about what code needs to be generated. For example, the ImportDependency knows how to instruct webpack to fetch the imported module asynchronously and make its exports available. These signals are often called runtime requirements. For instance, if a module exports its members, there will be a corresponding dependency (like HarmonyExportSpecifierDependency) that tells webpack to implement the logic for handling exports.
In essence, every module brings along its own runtime requirements, which are determined by what that module actually uses. The runtime requirements of a chunk are the union of all runtime requirements from every module within that chunk. Armed with this information, webpack can reliably generate the necessary runtime code.
This is often referred to as the rendering process, and it deserves its own deep dive in a separate article. For now, it's sufficient to understand that rendering relies heavily on the ChunkGraph. The graph contains groups of chunks (ChunkGroup, EntryPoint), which hold chunks, which hold modules, and within those modules are the granular hints that guide webpack's code generation.
This brings the theoretical portion of the article to a close. In the next section, we'll look at practical ways to debug webpack's source code — a skill that's invaluable whether you're troubleshooting an issue or simply curious about how webpack operates.
Inspecting webpack's internals with a debugger
Now that we've covered the theoretical parts of the bundling pipeline, let's shift our attention to the practical side: how to actually step through webpack's code and observe the mechanics in action. We'll look at where to set breakpoints to examine different stages of the process.
Setting up VS Code for debugging
VS Code offers a rich set of tools for code navigation, which makes it a solid choice for this kind of deep dive.
The method we'll use involves pulling the webpack repository into a separate project via git submodules to be our own understanding-webpack directory.
Now, I've put together a repository named understanding-webpack that demonstrates this setup. If you'd like to follow along, you can configure your project like this:
git clone --recurse-submodules git@github.com:Andrei0872/understanding-webpack.git
yarn
Inside, you'll find an examples folder where every scenario lives in its own directory. The package.json file should look similar to this:
"scripts": {
    "understand": "yarn import-order",
    "import-order": "webpack --config ./examples/import-order/webpack.config.js",

    "create-example": "cd examples && cp -r dummy-example"
  },
My workflow follows a couple of simple conventions: the yarn understand command always runs whatever example is currently selected — by default, it executes import-order. Each example has its dedicated script (named after the folder), like import-order above. To switch examples and debug custom setups, edit examples/import-order to point at the example, and update the main script to match the script name (e.g., yarn import-order).
Now let's get to the actual debugging. In the repo, there's a [.vscode/launch.json](https://github.com/Andrei0872/understanding-webpack/blob/master/.vscode/launch.json) configuration that sets up the debugging environment. To test it quickly, before hitting F5 to start the debugger, open webpack/lib/Compilation.js (press CTRL + P, type the path, then CTRL + SHIFT + O and look for seal) and set a breakpoint inside the seal() function.
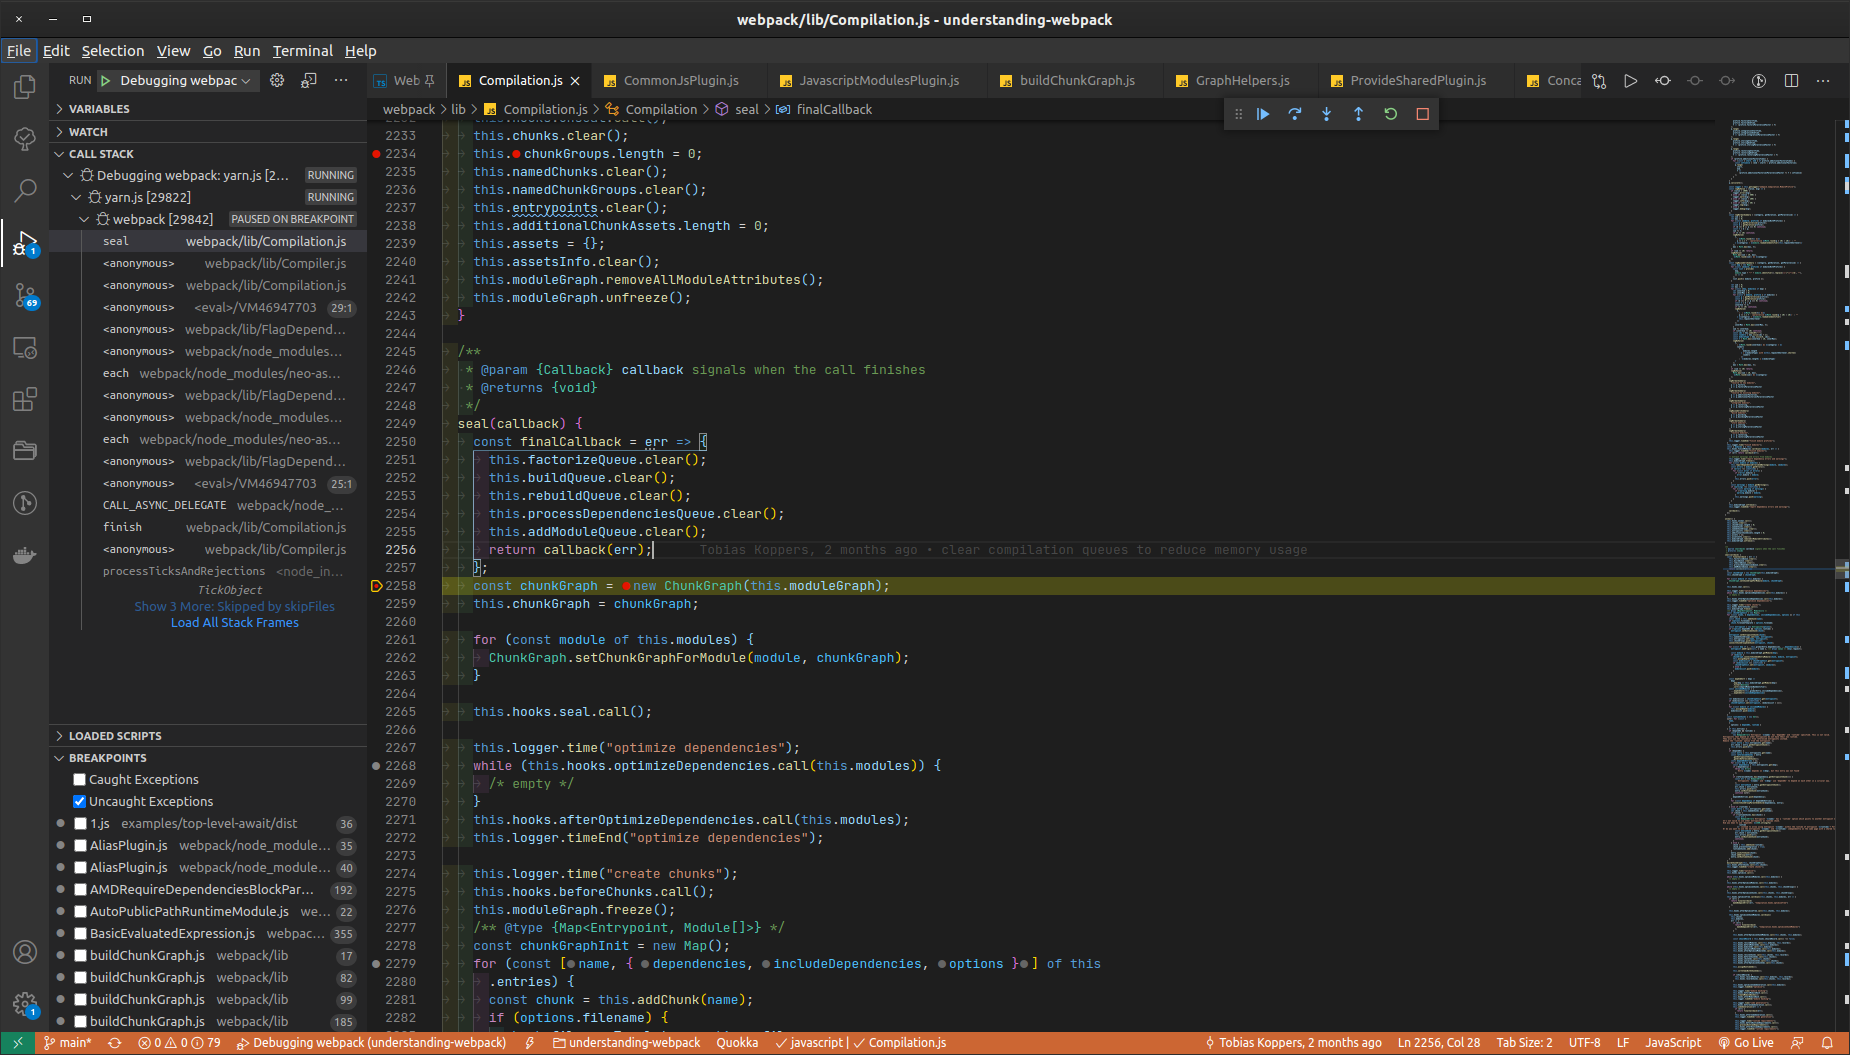
For context, the seal method orchestrates a large portion of the core pipeline depicted in the main overview: it creates the initial chunks, builds the ChunkGraph, generates runtime code, and constructs chunk assets.
That covers debugging your own custom examples. Now let's look at how you'd debug webpack's own test suite or any of the scripts it declares in its package.json.
Important note: if webpack is running in production mode — or more precisely, if the terser plugin is involved — you may run into limitations with VS Code's built-in debugger. The reason is that terser-webpack-plugin relies on jest-worker, which spawns worker_threads or child processes, and VS Code's debugger doesn't handle those well (at least as far as I know). In that case, I recommend ndb. Once installed, navigate to the webpack submodule directory and launch ndb there — it opens a dedicated window where you can choose the script you want to debug and set breakpoints just like in a standard editor.
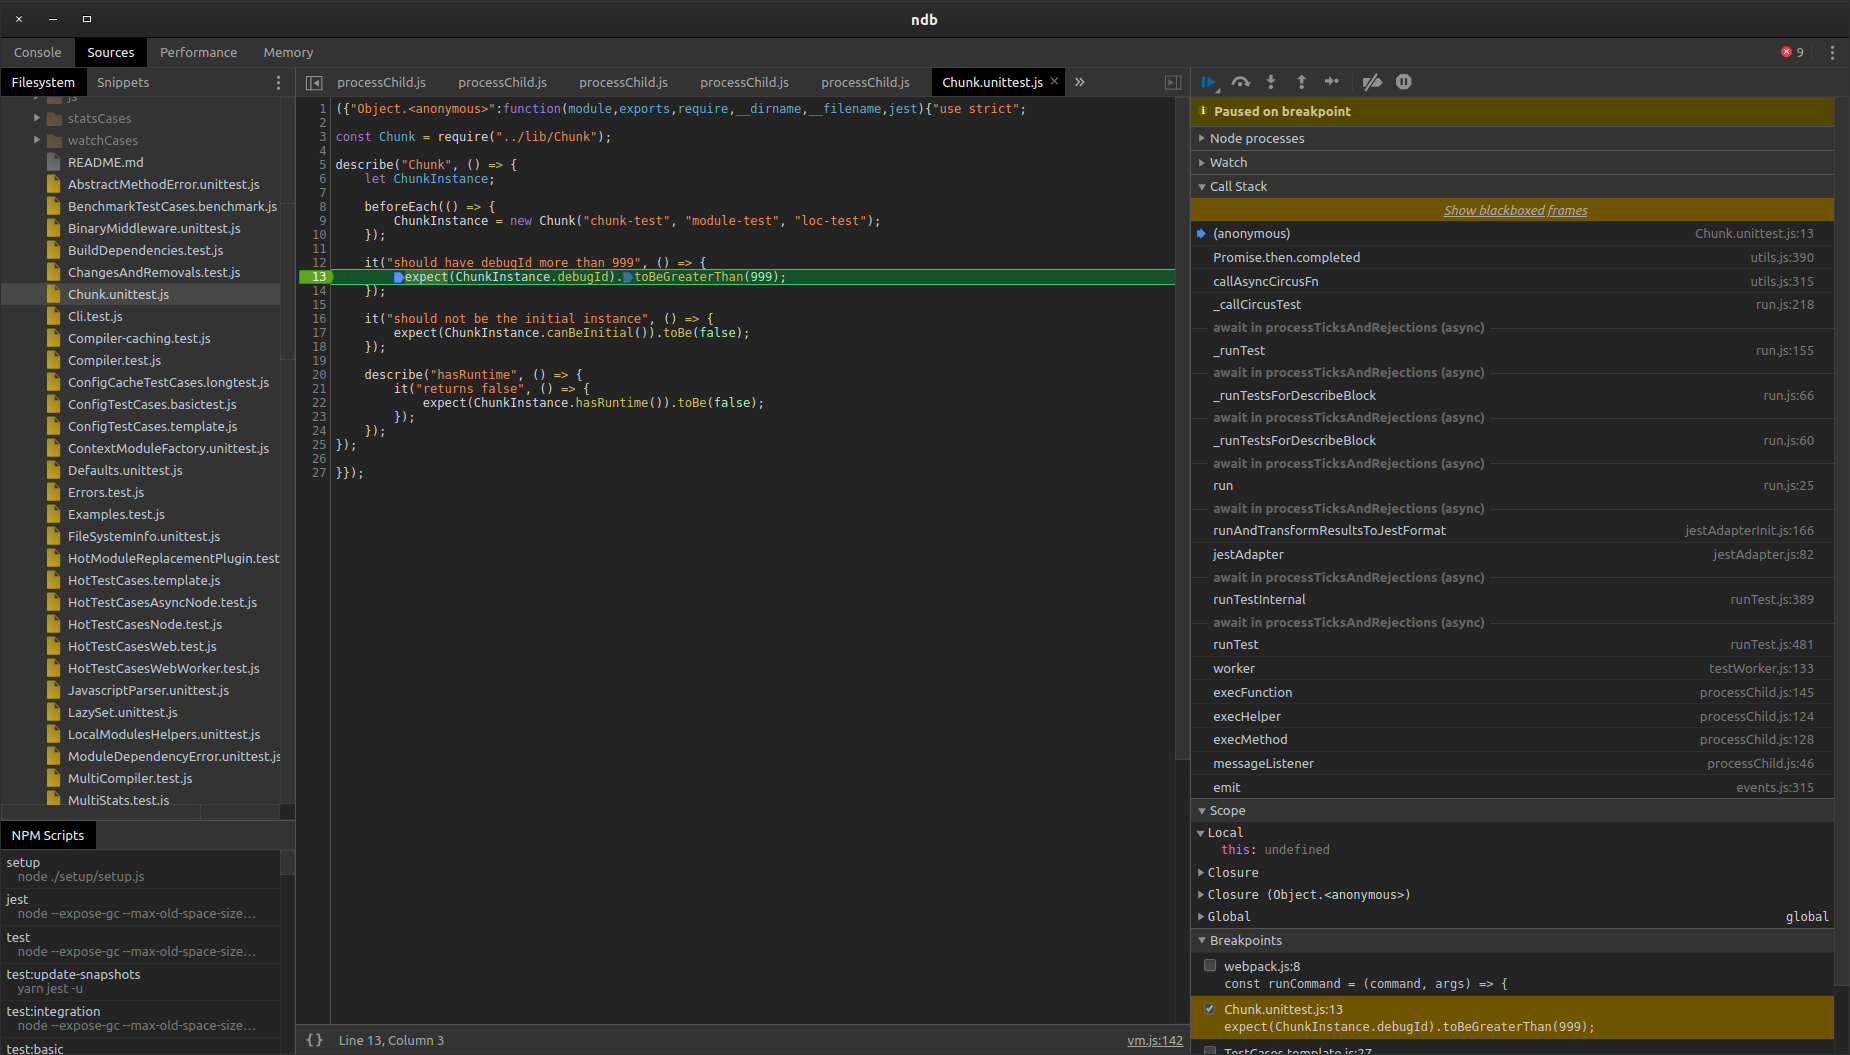
For instance, I set a breakpoint inside Chunk.unittest.js before running the test:unit script via ndb's UI (the script selector is in the bottom-left corner):
If you need to run only a subset of tests, you can use a command like this:
// The options are taken from one of the `package.json` scripts
// Simply replace `TestCases.template.js` with other file name if you want
// to debug something else.
ndb node --max-old-space-size=4096 --trace-deprecation node_modules/jest-cli/bin/jest --testMatch "<rootDir>/test/TestCases.template.js"
One major advantage of ndb is its ability to attach the debugger to code executed on worker threads or in separate processes — something that's hard to achieve in standard IDE debuggers. So, to debug terser's minification on your custom example, run ndb yarn understand from the project root:
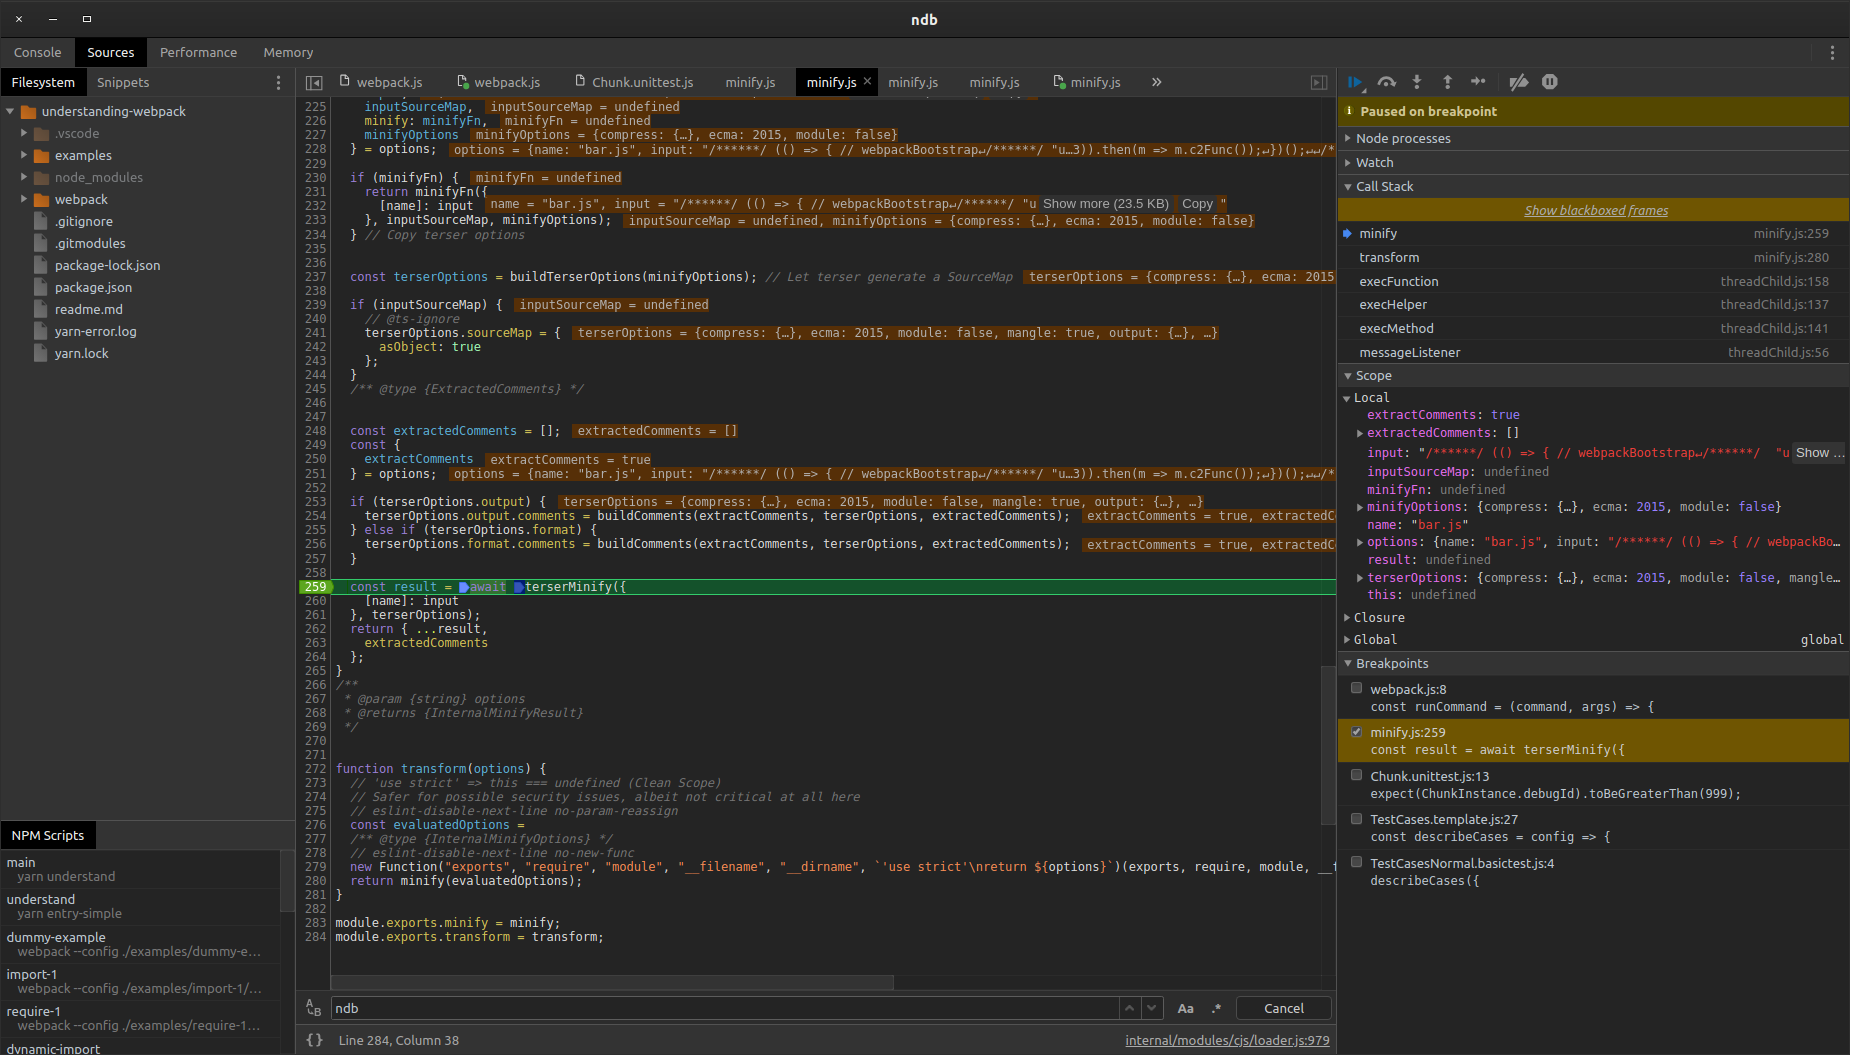
That file lives at webpack/node_modules/terser-webpack-plugin/dist/minify.js. A breakpoint there won't fire in VS Code, but with ndb it's hit without any issue.
If you want to observe the bundling process start to finish, place a breakpoint at the createCompiler function inside webpack/lib/webpack.js.
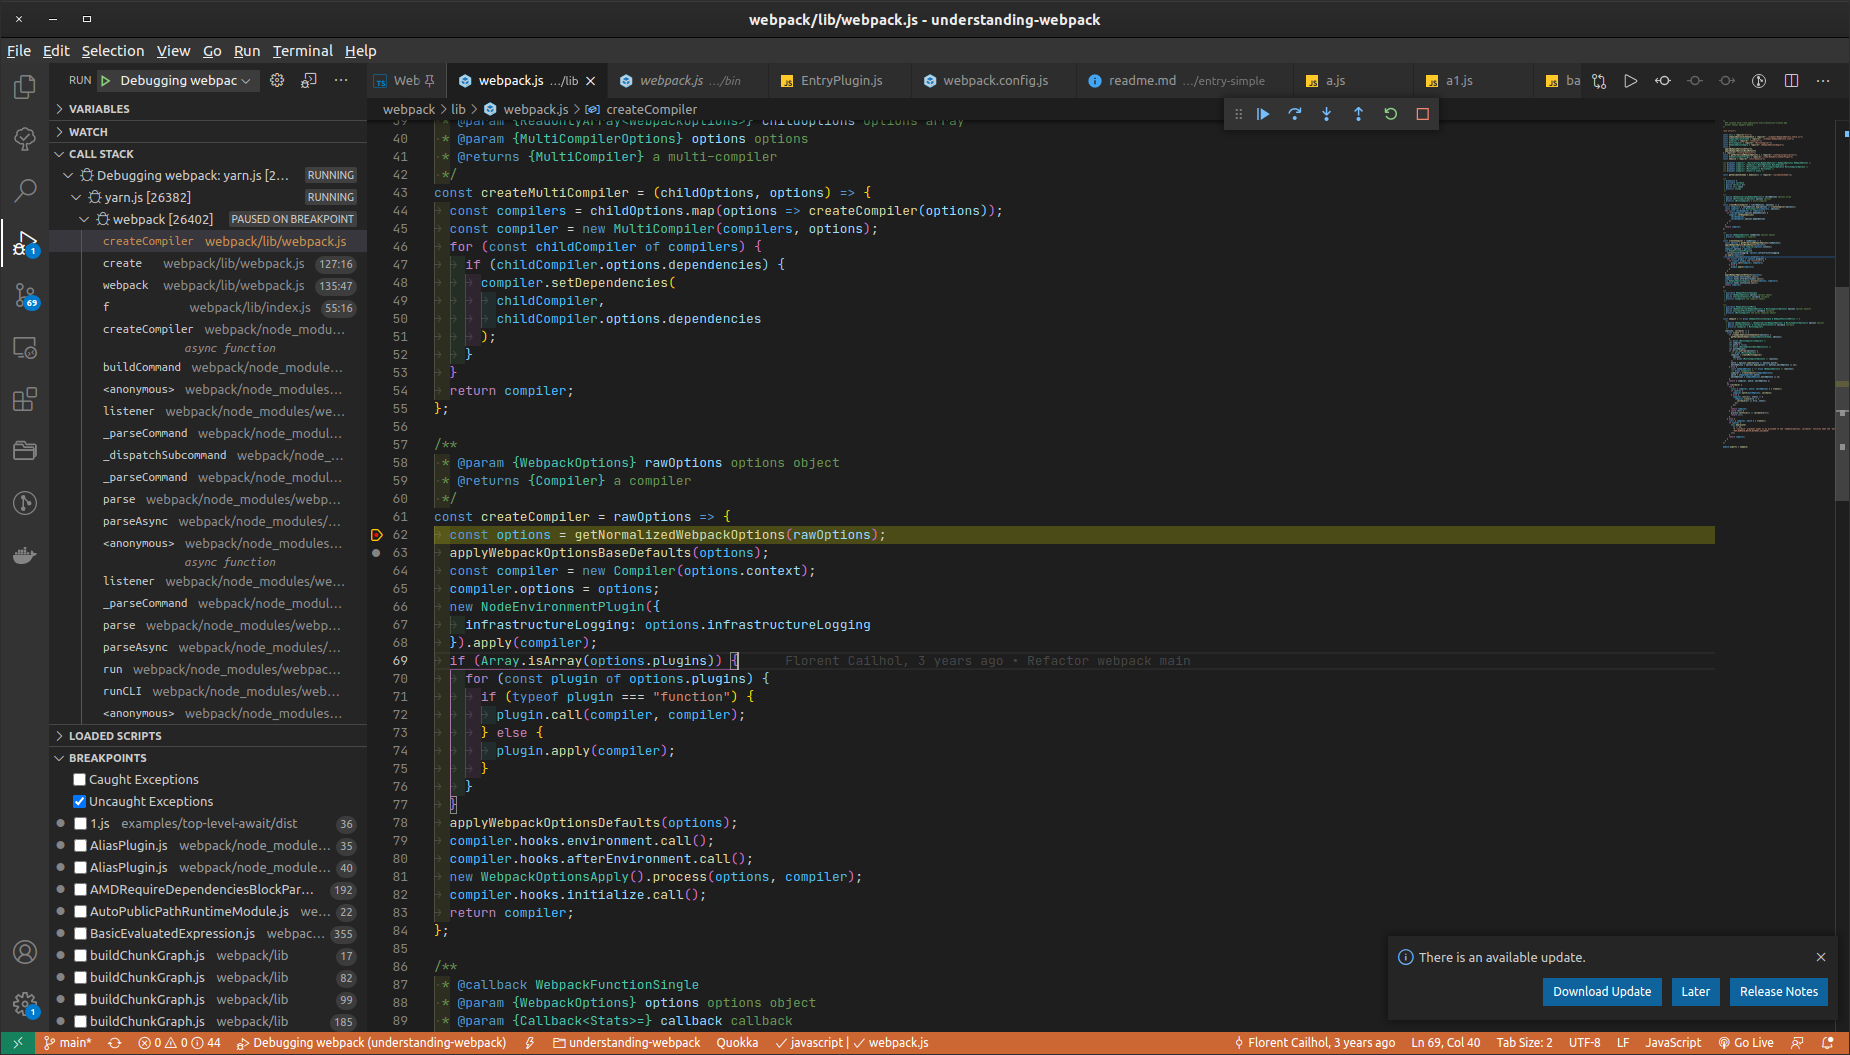
That's also a great place to inspect webpack's default configuration values.
So, the rule of thumb is: use ndb any time you need to debug code that runs in worker_threads or in a separate process from the one you initially started the debugger with.
Quick navigation shortcuts for webpack's codebase
Note: this section assumes you're using the VS Code editor.
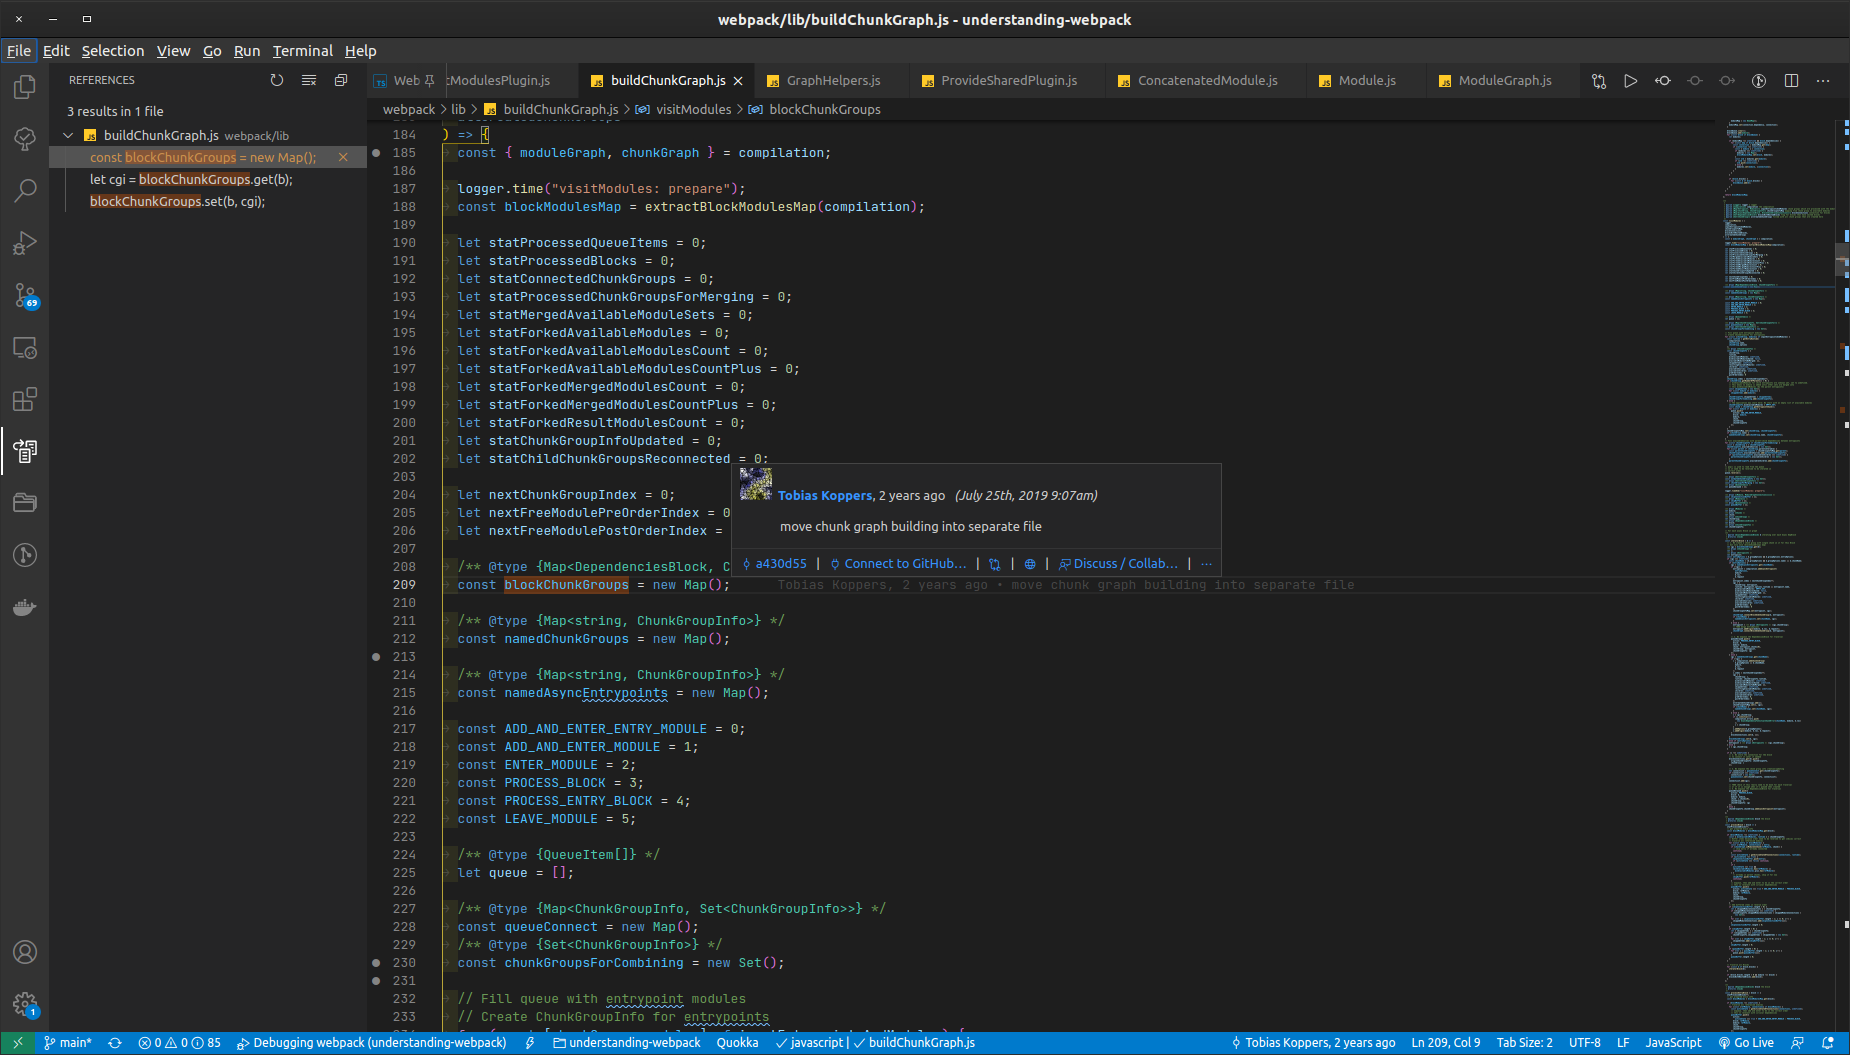
- press
CTRL + SHIFT + F12to find every reference to any function, constant, or variable across the repo:
- use
CTRL + SHIFT + \to jump to the matching parenthesis or bracket - use
ALT + SHIFT + Hto view the call hierarchy of a given function
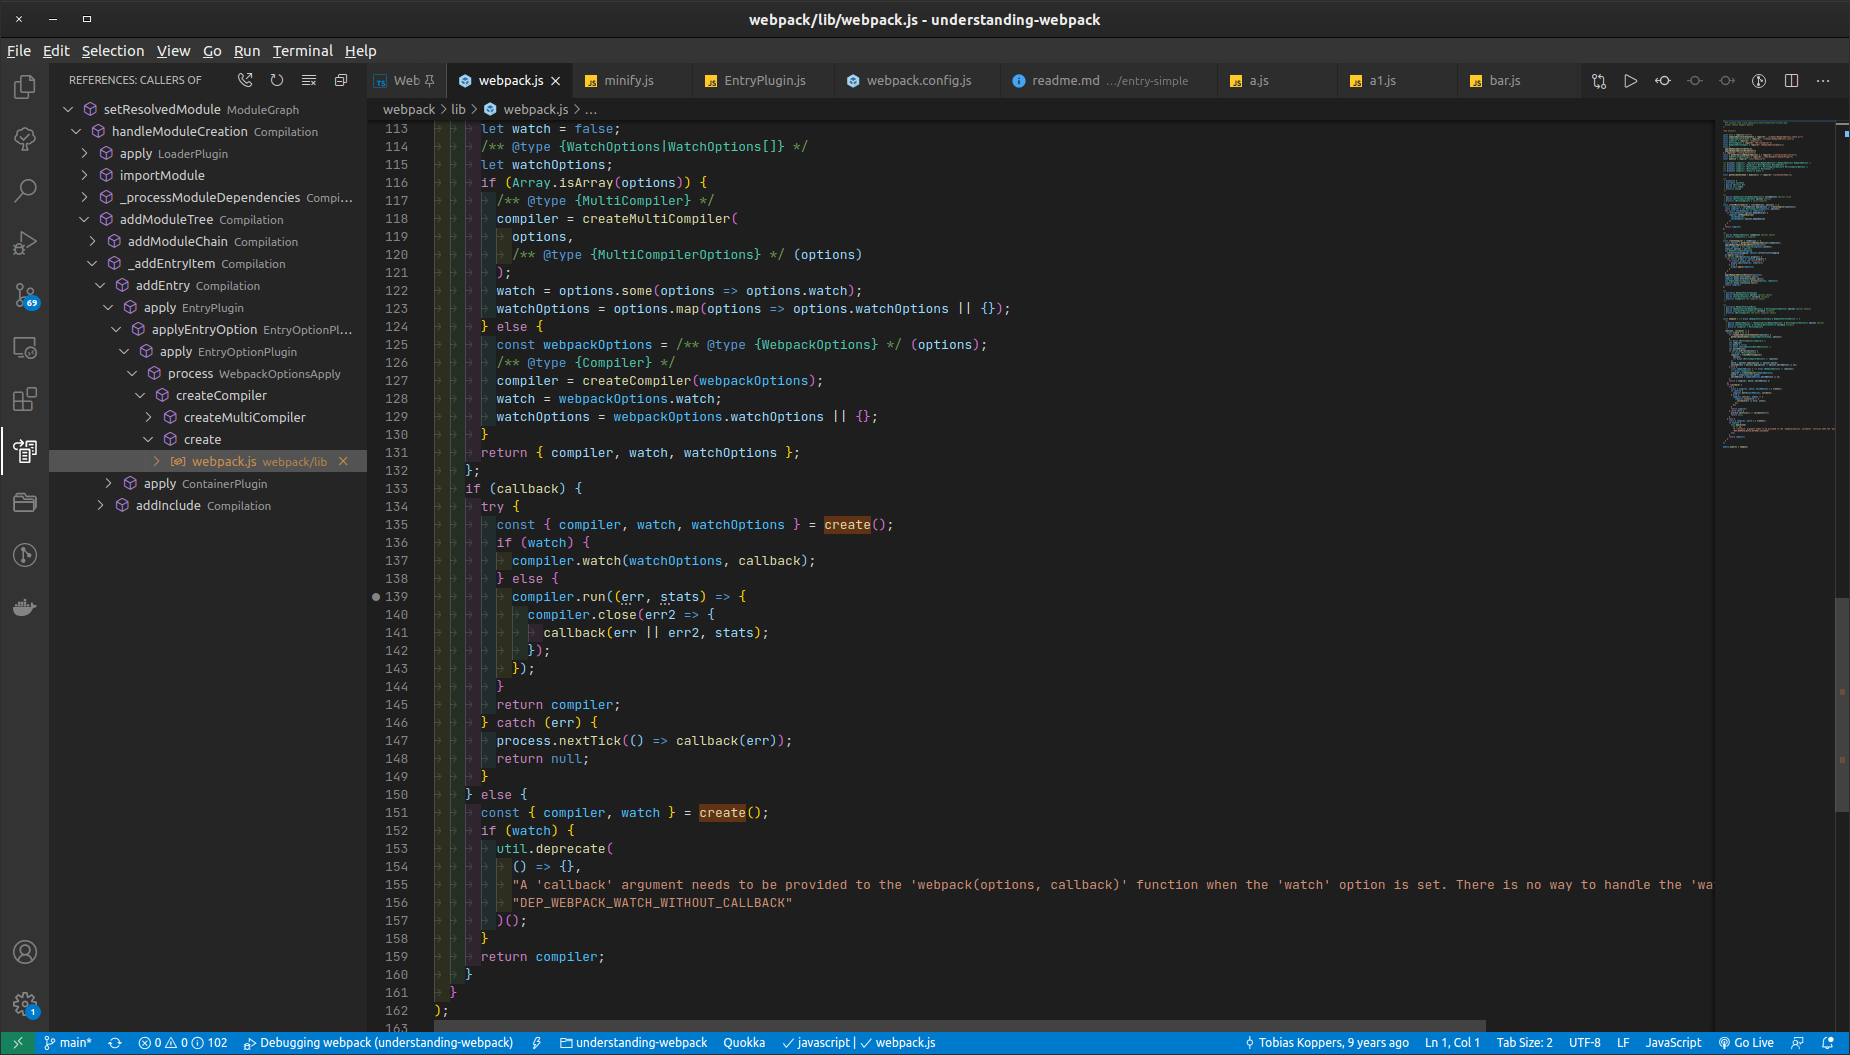
The screenshot above shows what triggers the invocation of setResolvedModule.
- to see which plugins contribute custom logic to webpack's built-in hooks, you can do a quick global search (
CTRL + SHIFT + F) for.hooks.nameOfTheHook.tap— since plugins add functionality via eithertaportapAsync:
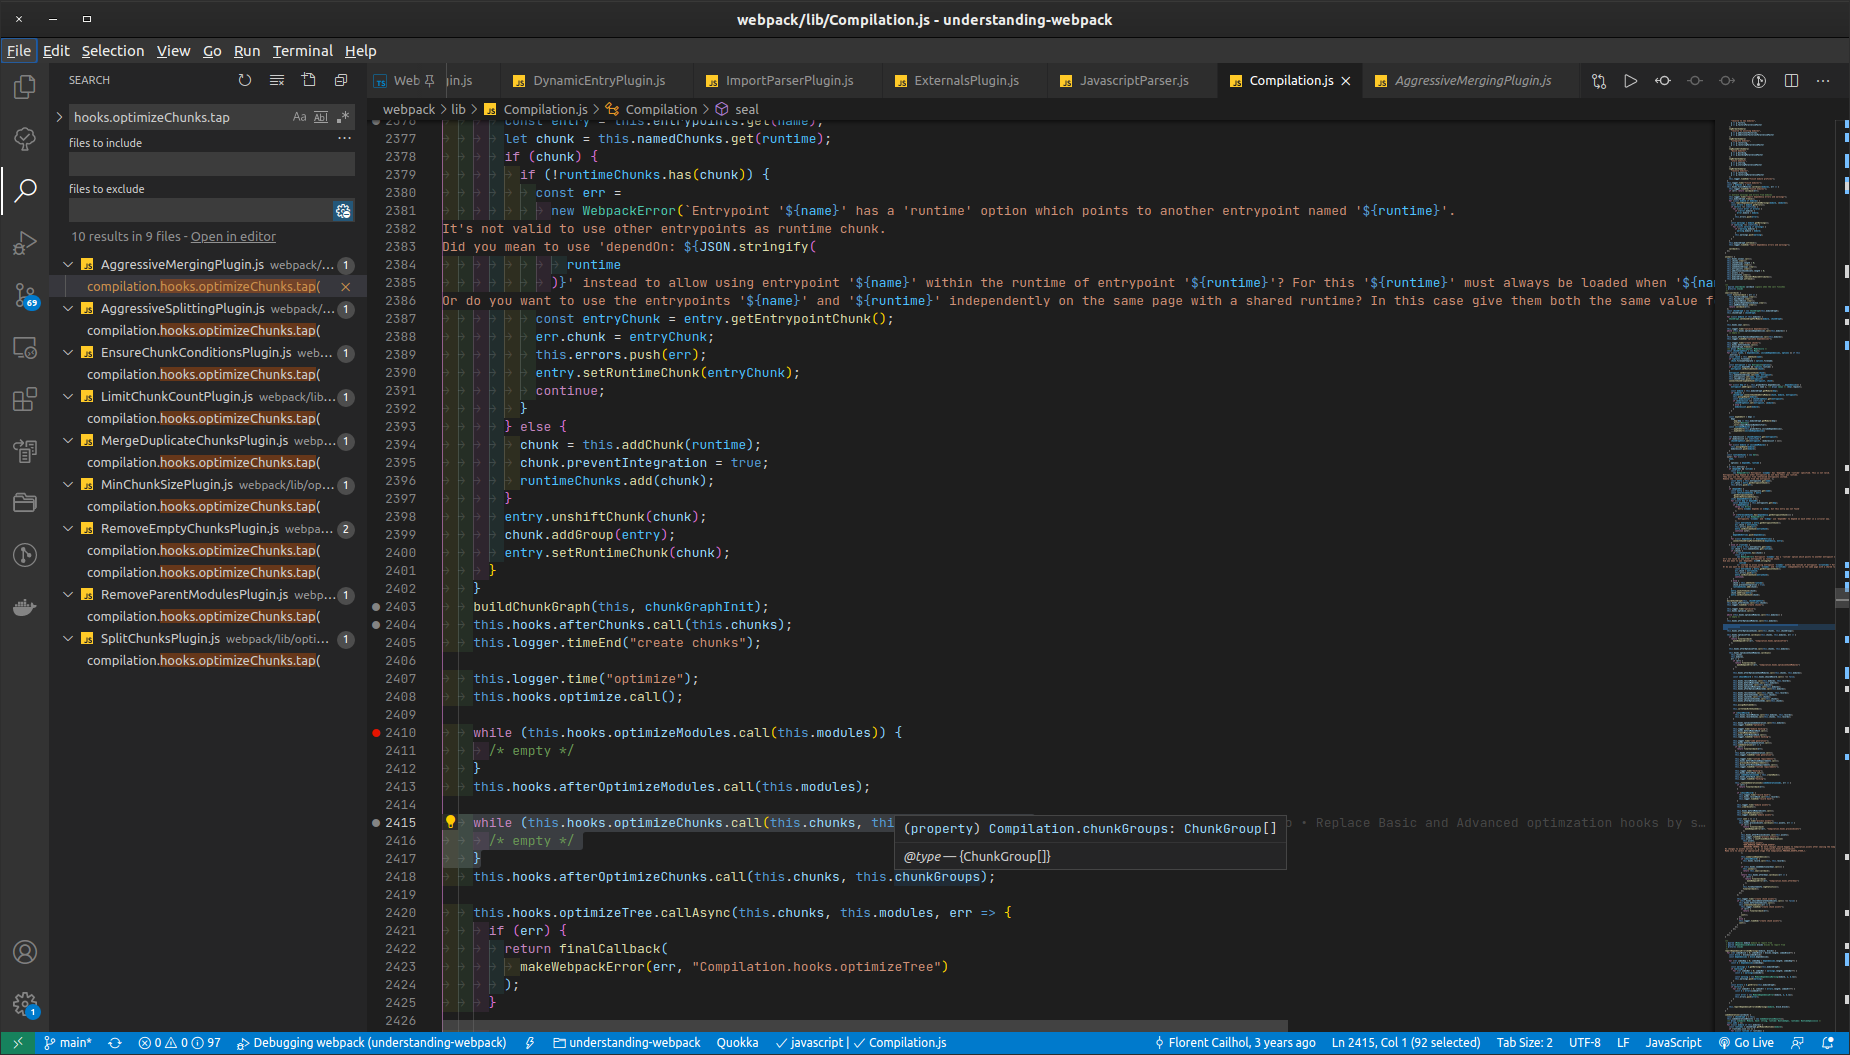
In the left panel, you can see which plugins attach their own logic to the optimizeChunks hook.
Alternatively, when you're in the middle of a debugging session, you can inspect the taps property on any hook object to see what plugins have registered there:
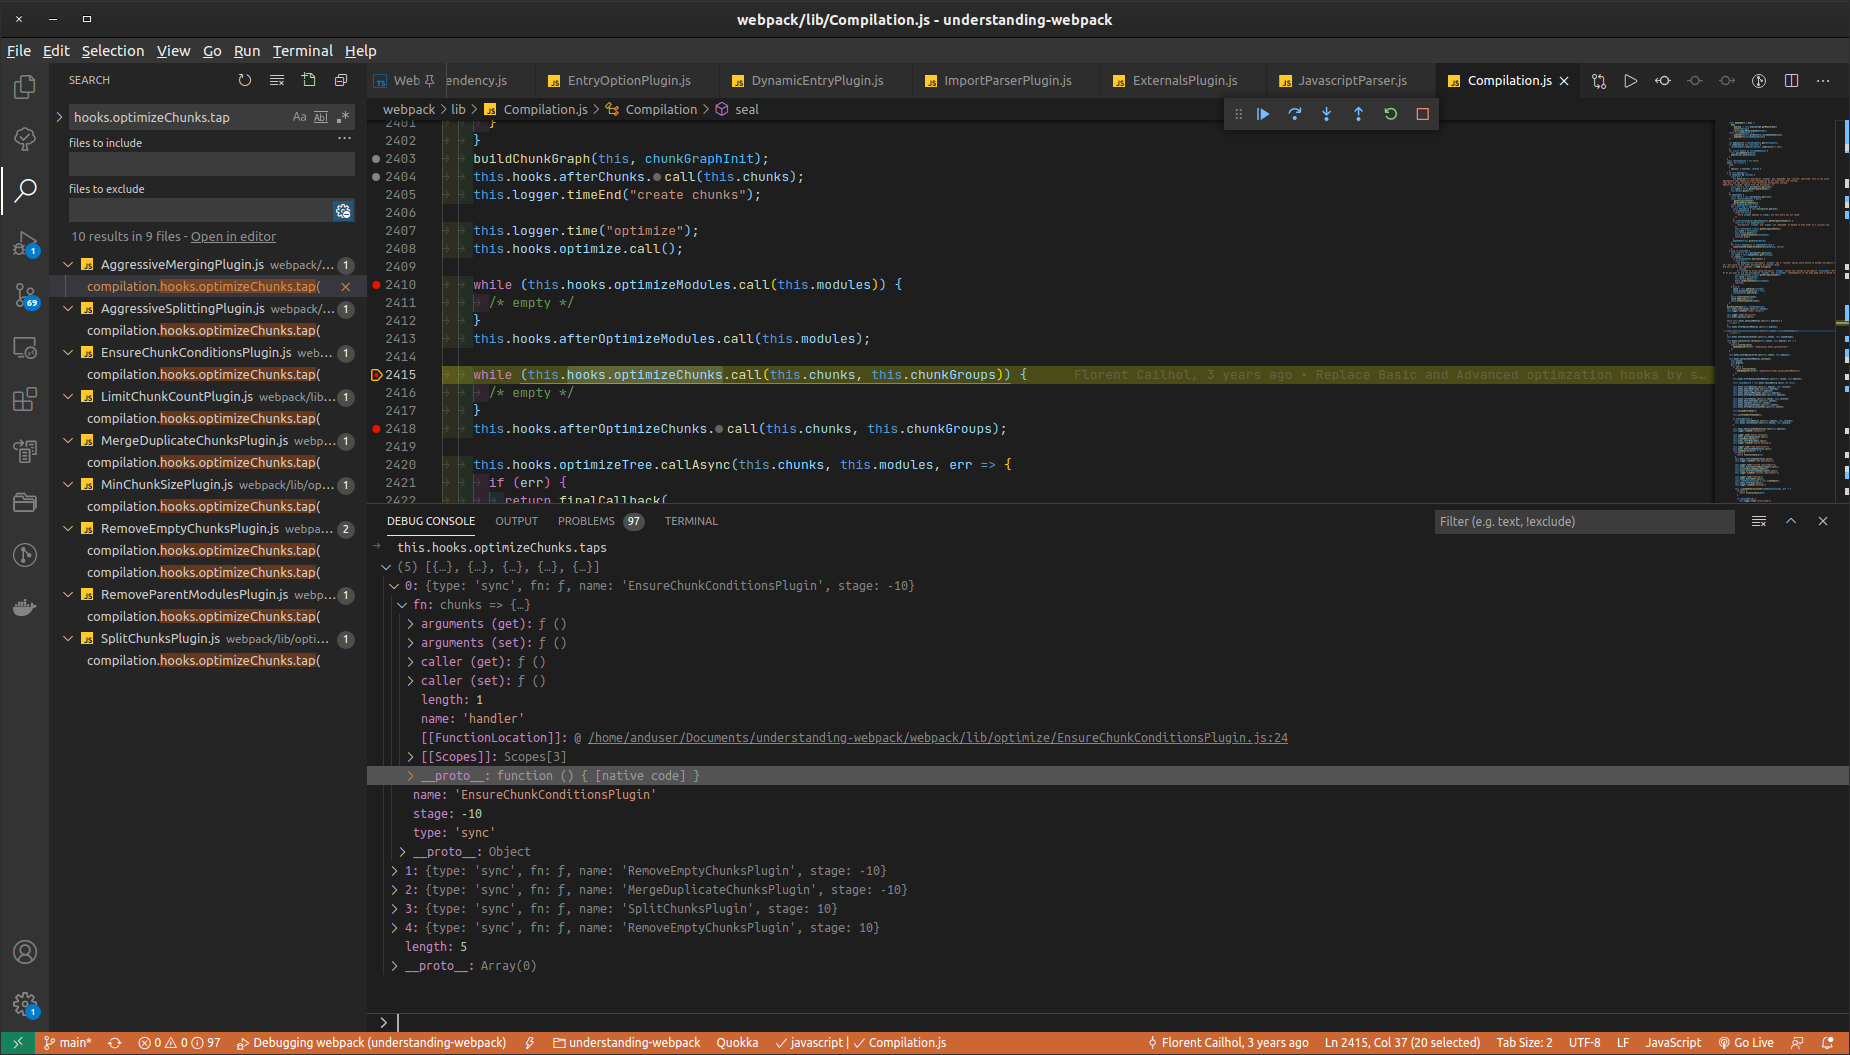
Debugging in StackBlitz
If you'd rather not leave the browser, StackBlitz is definitely worth knowing. It replicates the entire flow we've just described from the VS Code section, and its support for debugging worker threads works out of the box — you don't even need a separate tool like ndb.
I've set up a base project called [webpack-base](https://stackblitz.com/edit/node-cazzv3?file=webpack.config.js) along with a short video walkthrough. I tend to fork that project each time I want to experiment with a particular webpack feature.
Suppose you want to begin exploring the bundling process from the compiler creation step. Here's how you can do that in StackBlitz (just remember to fork the project first):
- issue
code node_modules/webpack/lib/webpack.jsin the terminal - jump to line 135 (using
CTRL + G, just like in VS Code) or look for the invocation of thecreatefunction viaCTRL + SHIFT + P - place a
debugger;statement on that line - open the DevTools panel
- execute the
npm run buildcommand in the terminal
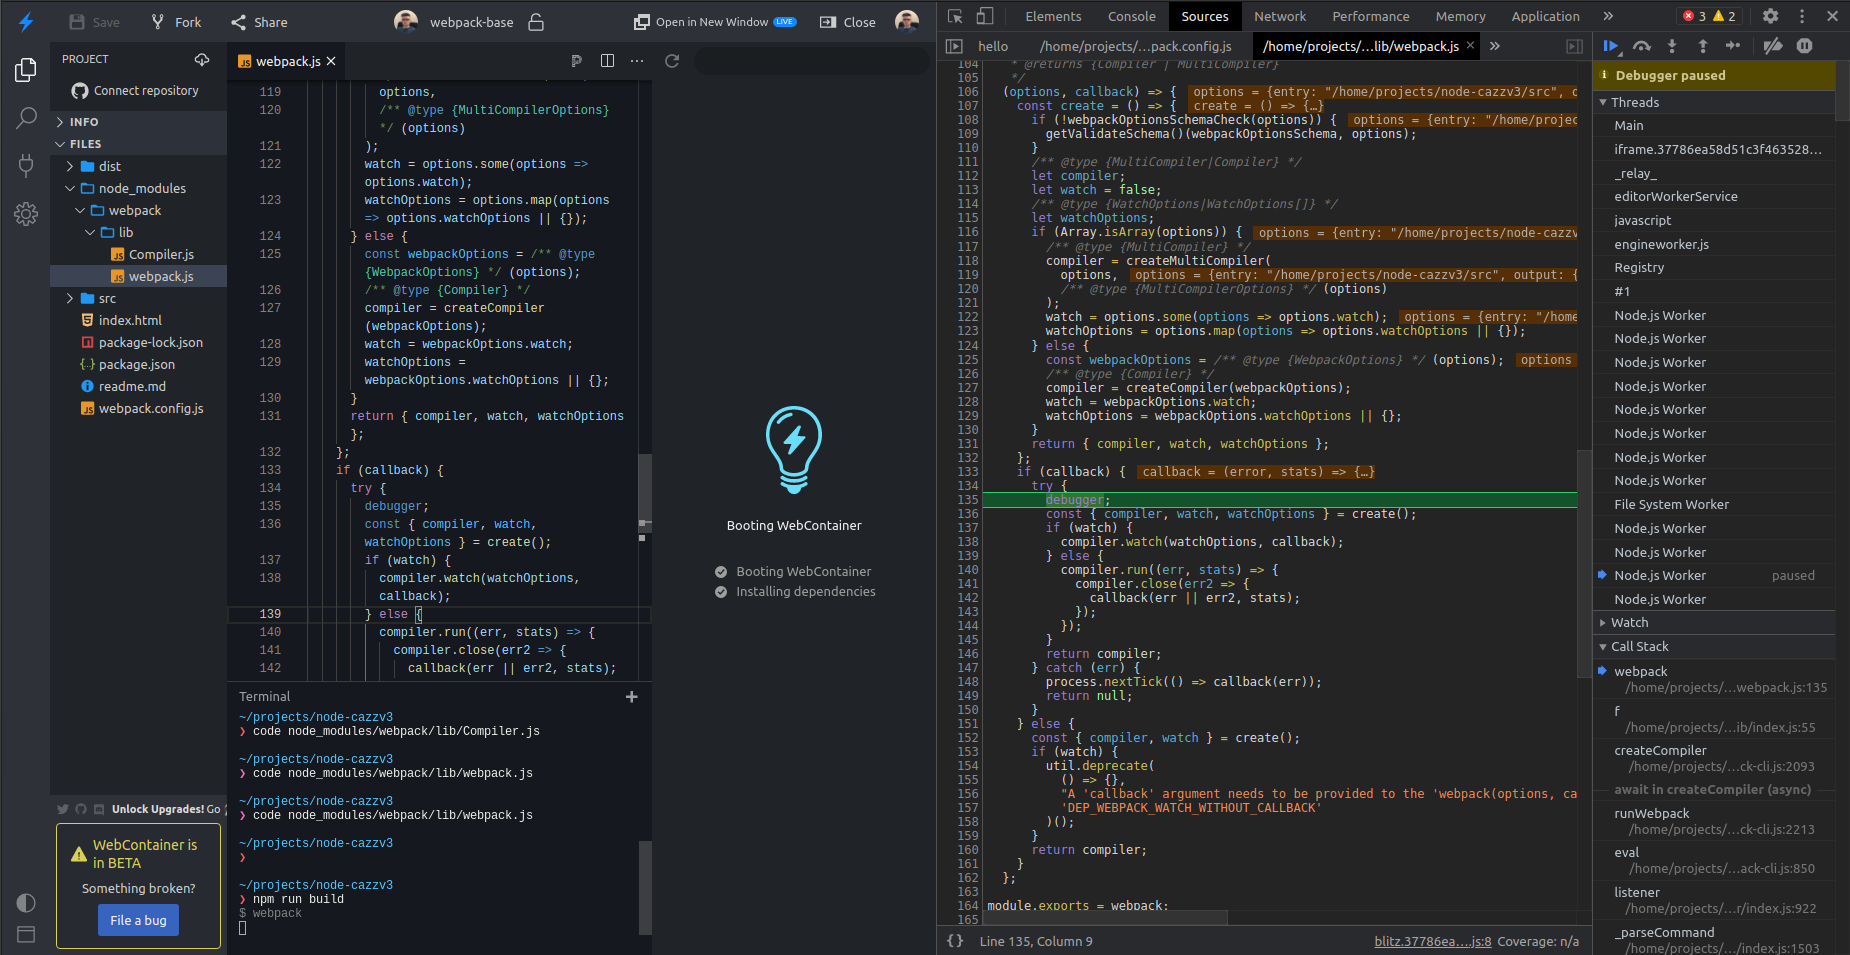
Resorting to the debugger; keyword makes it much simpler to locate the file in the Sources tab afterward. From there, you can set breakpoints by clicking on line numbers, conditionally pause execution, step through the code, and so on.
Tip: the same technique works for any node script, not just webpack itself.
Wrapping up
My goal with this series was to present a practical, no-fluff look at webpack's inner workings — enough depth to see it from a fresh angle, without dragging you through unnecessary details. As complex as it is, webpack is also quite elegant, and I hope this breakdown has made its main pieces more approachable.
Thanks for sticking with me!
All diagrams were created with Excalidraw.
Special thanks to Max Koretskyi for the thoughtful review and feedback on this article.