
Benchmarking Ivy: What It Really Changes for Your Build
Conference talks are full of impressive charts and benchmarks. But what does Ivy actually mean for a real-world application? This article looks at two concrete metrics: bundle sizes and compilation times.
We won't dive into Ivy's internal mechanics here. If you're curious about how it works under the hood, check out this in-depth article on its compilation, runtime, and change detection. For other updates, the official blog posts for Angular 9 and Angular 9.1 are the best sources.
The Application Under Test
Results with Ivy depend heavily on the application. My benchmarks are specific to the project I work on. Here’s its context:
A single Nx monorepo houses two apps: a large main product and a smaller support application. They share a codebase that's been in development for two years.
- 130,000 lines of TypeScript and HTML
- 800 components
- 140+ lazy-loaded modules
I ran these tests on Angular 9.0.6, both with Ivy enabled and disabled. Where relevant, I compared ES5 and ES2015 bundles. Bundle sizes were measured with the webpack bundle analyzer. I also used source map explorer, and the results were consistent.
Since then, we've upgraded to Angular 9.1; I'll point out where that makes a difference.
Analyzing Bundle Size
All measurements were taken for both gzipped and non-gzipped outputs. For simplicity, the analysis below focuses on ES5 builds.
The Angular team provides these general expectations:
- Small applications: 30% size reduction
- Medium applications: 2% size reduction
- Large applications: 25–45% size reduction
Overall Build Size
The total build size gives a high-level view of the improvements Ivy brings.
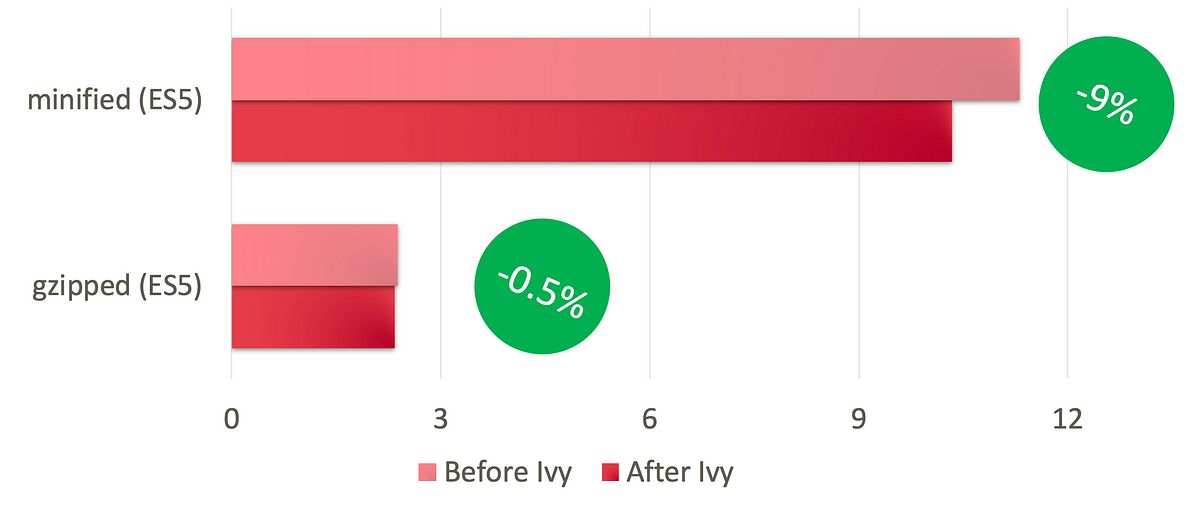
Total production bundle sizes are listed in Megabytes.
The Gzip Metric Isn't the Whole Story
Looking only at the total doesn't reveal what's happening internally. The build is split into a main.js file (loaded first) and over 140 lazy-loaded modules.
Let's break the comparison down:
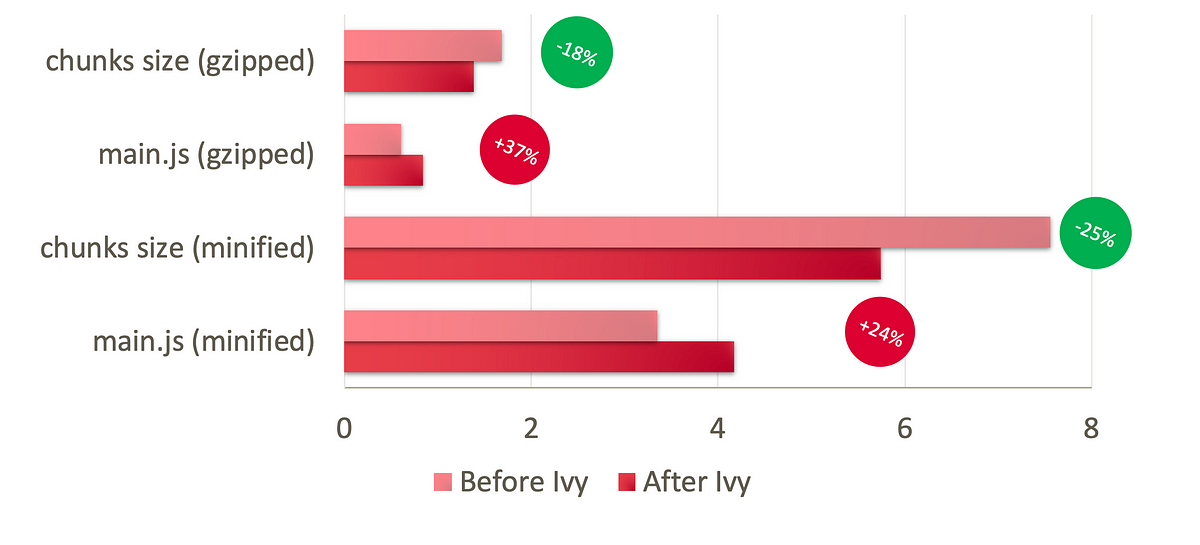
Comparison of the main.js file versus the sum of all lazy-loaded chunks, measured in Megabytes.
Why is main.js Larger?
The lazy-loaded chunks are compiled directly with Ivy, which results in minified bundles that are 20–30% smaller after gzipping. That's a solid win.
But what about main.js? It should be much smaller, thanks to Ivy's improved tree-shaking of the Angular framework itself. Let's see what's in it:
- The Angular framework
- Other Angular libraries
- Utility libraries
- Components and services that can't be lazy-loaded
Utility libraries and Angular Services aren't affected by Ivy at all. To get a clearer picture, let's isolate just the Angular framework and our component library:
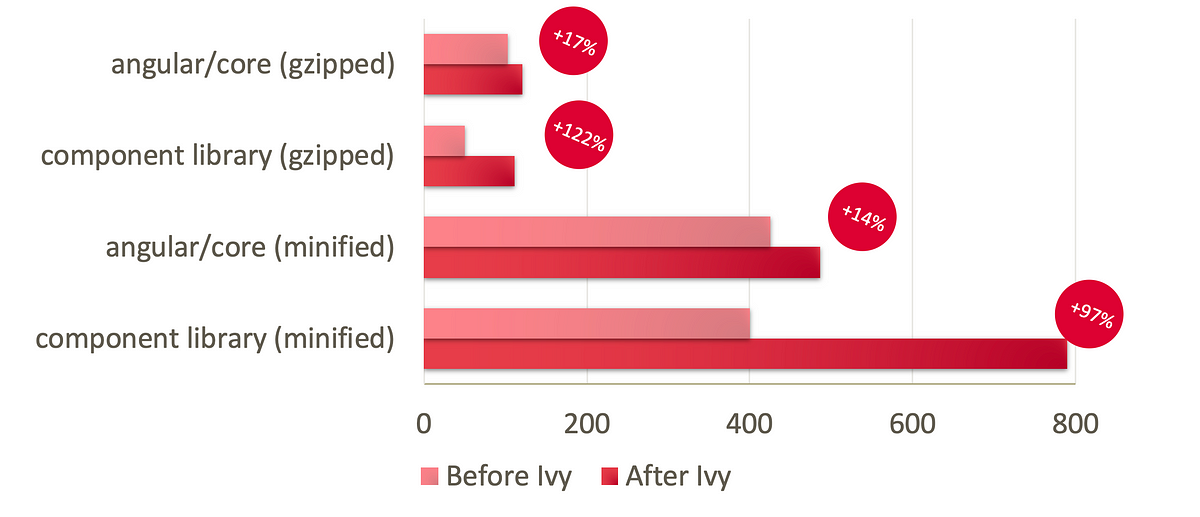
Angular library (left) and our in-house Barista components library, measured in Kilobytes.
This reveals the real story. In Angular 9, every Angular library—the framework, component libraries, NgRx—must be re-compiled with the ngcc tool to work with the Ivy runtime. This process can slightly increase their size.
Another factor: with Ivy, fewer lazy-loaded chunks are generated. Our pre-Ivy build produced 143 JS files; with Ivy, that number dropped to 37, generated only for root-level lazy modules. More code is therefore landing in main.js.
This might be linked to a known breaking change in the Ivy compatibility guide, which suggests a fix we tried implementing without any success.
Should this cause concern? It looks bad on a chart, but it's a temporary situation. The plan for Angular 10 is to remove the need for ngcc altogether. I'm confident the numbers will improve once the migration period is over. Here's why:
- Libraries are currently compiled in JIT mode, then re-compiled with
ngcc. - Angular 10 will see libraries publish code compiled with Ivy and AOT.
- This eliminates the need for compatibility layers via
ngcc. - The AOT-compiled output is an added bonus, further reducing library size.
Compilation Speed Benchmarks
Production Build
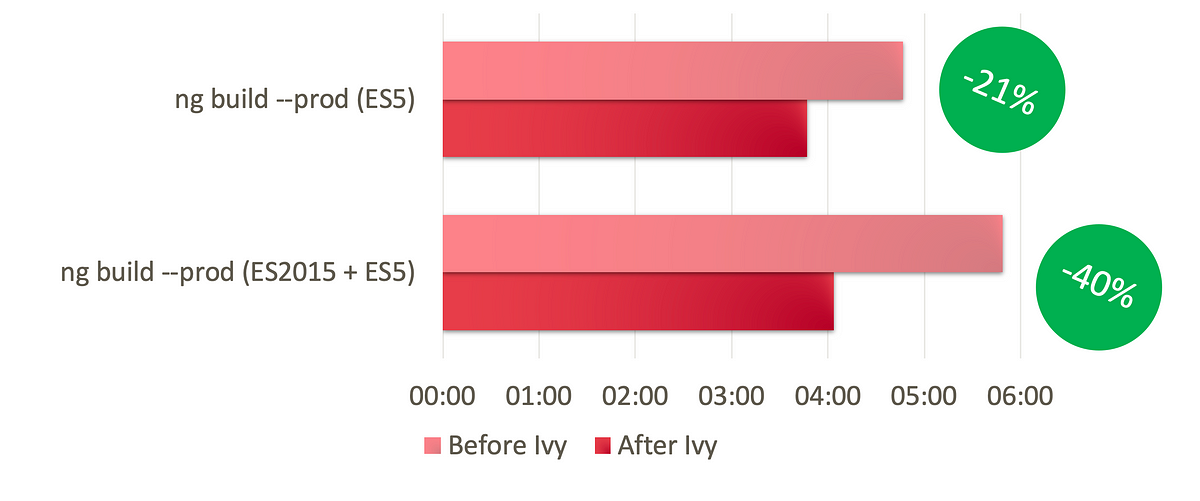
Production build times are shown in minutes.
The differential loading build (generating both ES2015 and ES5) was traditionally slower, needing to create two output packages. Ivy speeds up both scenarios, shaving off about one minute of build time. It also reduces the gap between them:
- 4 minutes instead of 6 for differential loading
- 3 minutes 40 seconds instead of 4 minutes 45 seconds for a standard ES5 build
That's a 20-30% improvement overall.
Development Build
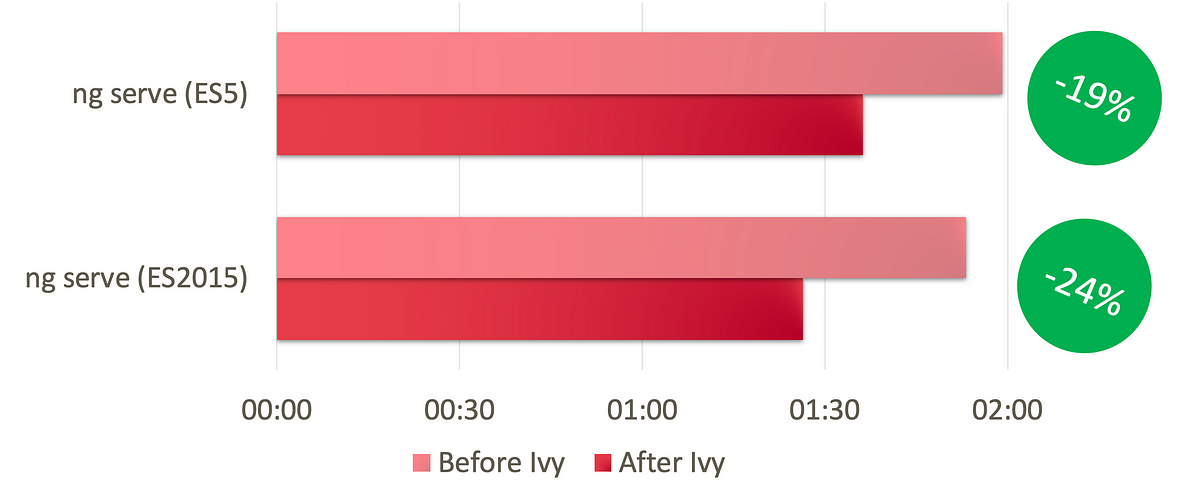
Development build times are shown in minutes.
Development builds don't use differential loading; we compile either ES2015 or ES5. ES2015 is consistently 10-20 seconds faster in this setup.
With Ivy enabled, the improvements are clear:
- ES2015: 1 minute 25 seconds vs. 1 minute 55 seconds
- ES5: 1 minute 40 seconds vs. 2 minutes
That's a 20-25% improvement, saving 30 seconds on every build. It's a noticeable gain for daily development.
Recompilation Time
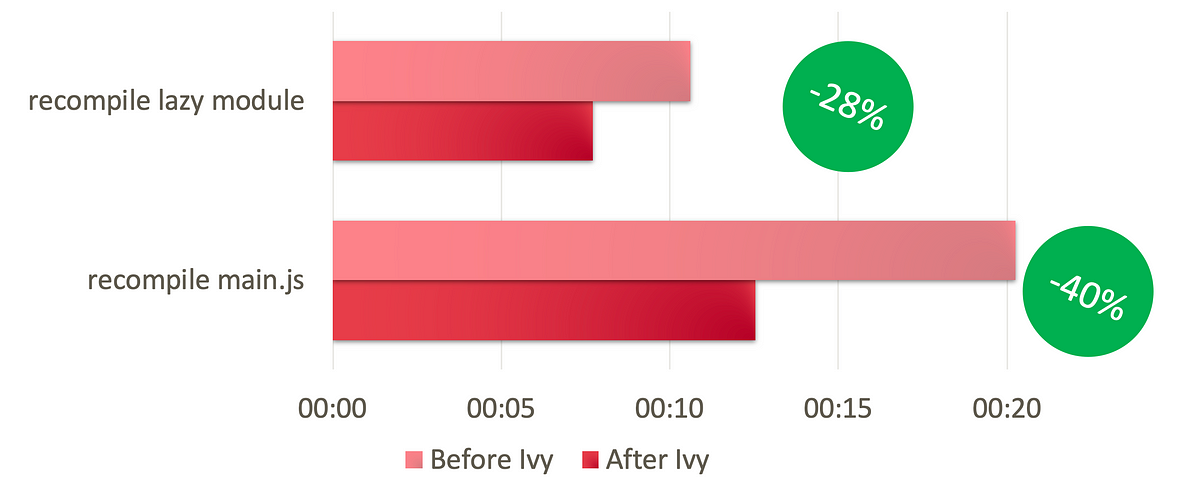
Re-compilation times are measured in minutes.
The speed of recompilation depends heavily on what you're editing. Smaller, lazy-loaded modules compile faster than files included in main.js.
We saw improvements after upgrading to Angular 8.2, mostly thanks to TypeScript. But the Ivy compiler has squeezed times down even further.
- Small, lazy-loaded module: 5-7 seconds vs. 10-12 seconds
- HTML change in a core component: 12-13 seconds vs. 20 seconds
That's a 30-40% improvement. Saving 5 seconds on every change makes a huge difference to the development experience.
It's Worth It
These results are impressive, especially considering we haven't fully optimized for Ivy yet. Further improvements are on the way.
However, there is a catch: libraries must be re-compiled with ngcc before a build. For us, this added 40-50 seconds in Angular 9.0, which dropped to 20-30 seconds in Angular 9.1.
Fortunately, Angular 9.1's ngcc is smart enough to run on-demand, not on every compilation or after every post-install change.
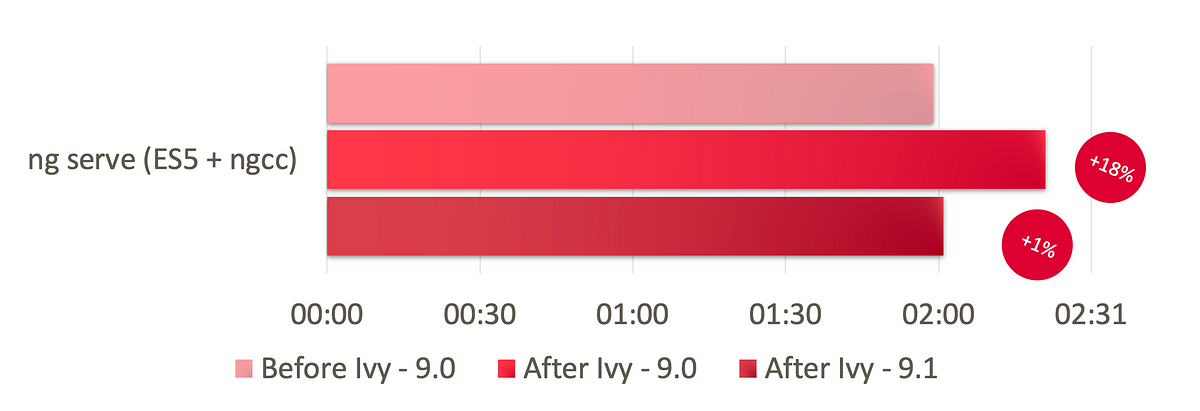
Development build time for the first run is shown in minutes.
This overhead only affects the initial run after adding or changing dependencies.
Unit Testing Speed
Ivy includes a new TestBed that caches component definitions, avoiding recompilation for each test. The expected speedup is 25-50%.
I can't confirm those numbers. We use jest with the preset for Angular configuration, and I saw no difference in our setup by simply toggling Ivy on or off.
Final Thoughts
You might feel the results don't justify the upgrade. That's not the case. ngcc does add overhead in both size and speed, but consider this:

I'm actually relieved the bundle size hasn't gotten worse during this migration period. We've already seen real build time benefits.
I'm grateful for ngcc, which allows library authors to create versions compatible with both Angular 8 and 9.
Most importantly, this approach prevents a community split between "Pre-Ivy" and "Post-Ivy" frameworks, avoiding the kind of division seen with Python 2 vs. Python 3 or Angular 1 vs. Angular 2+.
In a follow-up post, I'll share tips for migrating to Angular 9 and 9.1 in a single commit. Is that even possible with all the breaking changes? Yes, but it requires careful action.
Bonus: A Valuable Lesson
Don't blame Ivy for poor performance if your build configuration has bugs.
The front-end toolchain is complex. A minor dependency can inflate your bundle or slow your build. It's essential to perform bundle analysis regularly to catch these issues early.
The Angular team works to make the runtime as efficient as possible, but a simple misconfiguration in something like a sass-loader can add megabytes of duplicated CSS.
Technology radar
We recently discovered that the sass-loader plugin was responsible for 50% of our build time. It took a month to find the bug.
This plugin has the potential to save hours of debugging and days of development time. https://t.co/gFKYkwCu16
— Piotr Lewandowski (@constjs) March 7, 2020
What about your projects? Have you run similar benchmarks? I'd love to hear about your experiences.