“ Debugging is twice as hard as writing the code in the first place__. Therefore, if you write the code as cleverly as possible, you are, by definition, not smart enough to debug it.__ ” — Brian Kernighan
Debugging is a core activity for every developer, especially when working on existing codebases. Consequently, mastering the available tools is essential. Unfortunately, the official Angular documentation on debugging tools and practices remains sparse, which is why this article aims to equip you with the skills to become an Angular debugging expert. The first section outlines the methodology I employ for source code debugging, while the second section explores the framework’s debugging API—accessible through the browser console, primarily via ng.probe functionalities.
Before diving in, note that all current debugging APIs are flagged as experimental and could change in upcoming Angular releases. The content discussed here is based on the current major version 4.x.x.
Navigating the Source Code
Angular’s source code is obtainable from two primary places—npm modules and the github repository. Unfortunately, the Angular npm package lacks easily accessible TypeScript (TS) sources; it only includes type declaration files:
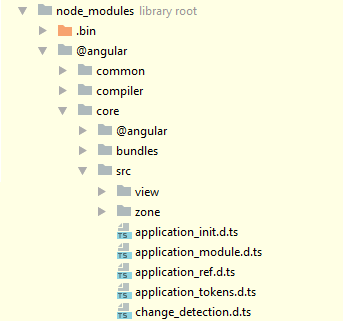
TS sources do appear inside the bundled JavaScript mapping files, specifically in the sourcesContent field. However, they are concatenated, rendering them unreadable.
If you desire to explore TS sources with full IDE support, you’ll need to clone the github repository locally and check out the target version using its corresponding tag. For instance, the command below clones the code into the ng directory and checks out version 4.0.1:
$ mkdir ng && cd $_
$ git clone https://github.com/angular/angular.git .
$ git checkout tags/4.0.1
Angular’s build pipeline bundles sources into UMD modules located at node_modules/[module-name]/bundles/[module-name].umd.js. Take the core module, for instance, situated at node_modules/core/bundles/core.umd.js. Angular also provides minified files and map files here. These files are loaded into a browser either via a module loader like SystemJS or as part of a bundler like Webpack. If SystemJS is unfamiliar, you can read more here about its purpose.
In my workflow, I use an IDE for source exploration and a browser debugger to trace execution flow via the call stack. For breakpoints and call stack analysis, I rely on JavaScript files rather than TypeScript. The primary reason is that debugging TS in a browser is not a smooth experience—here is just one illustration.
Reading compiled JS is not particularly difficult, provided you ensure the non-minified version is loaded in the browser. Currently, both SystemJS and Angular-cli are set to load the non-minified files. When I encounter something unclear in the JS, I cross-reference the TS sources from the repository. If I need to debug a specific functionality in JS, I identify its module, open that module in the browser, locate the relevant code segment, and place a breakpoint. For example, examining the enableDebugTools function:
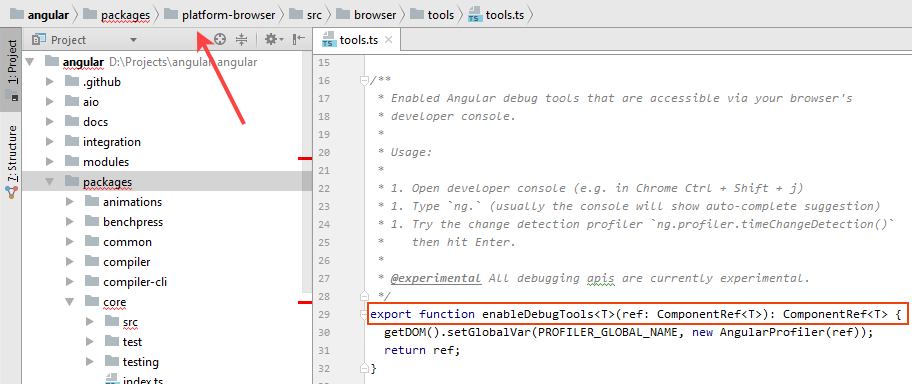
It resides in the platform-browser module. Accordingly, I open the browser, search for the platform-browser.umd.js file, and find the function:
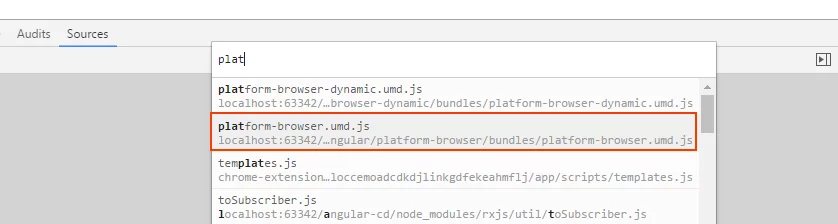
then locate the function:
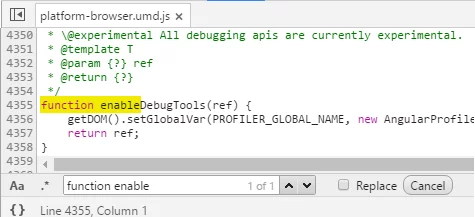
This method works unless you use Angular-CLI, which relies on Webpack to bundle everything into a single large file. You can still locate the function there, but I suggest debugging with a minimal setup that avoids bundlers entirely.
Occasionally, you may need to set a breakpoint within a one-line function expression:
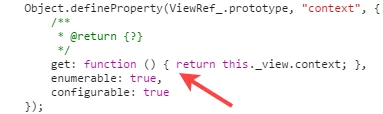
This is straightforward with the recent 58th Chrome version:
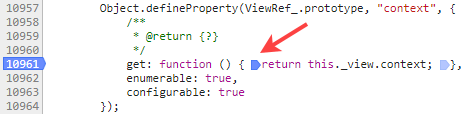
However, older browsers present challenges. One workaround is to open the relevant bundle in node_modules and insert line breaks:
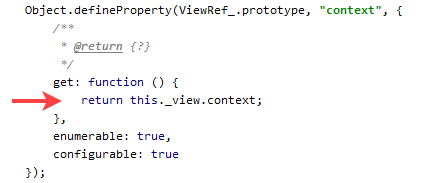
This allows you to place a breakpoint there. Alternatively, you could add a debugger statement directly inside the function without altering line breaks. Yet, I avoid such statements since they cannot be toggled off.
For debugging Angular applications, I strongly advocate using a minimal setup. For instance, check out this Angular seed project that I use personally.
Inspecting Angular apps through the browser console
Reaching into modules from the console
Sometimes during a debugging session you’ll want to pull up a specific module and its exported members directly in the console. With a module loader such as SystemJS this is straightforward. SystemJS loads modules via System.import, which returns a promise that resolves once the module is available. For instance, to grab enableDebugTools and disableDebugTools from @angular/platform-browser, you’d write:
System.import("@angular/platform-browser").then(function(module) {
  enableDebugTools = module.enableDebugTools;
  disableDebugTools = module.disableDebugTools;
});
Webpack, on the other hand, behaves differently. It acts as a bundler rather than a module loader, so it wraps everything internally into a single bundle and offers no direct mechanism to reach modules from outside that bundle. While there are workarounds, most of them involve editing webpack.config.js, which can easily break your build if you’re not comfortable with Webpack’s internals.
A much simpler tactic is to create an auxiliary file, say globals.ts, in your project containing the exports you want to access:
import * as core from '@angular/core';
import * as common from '@angular/common';
import * as compiler from '@angular/compiler';
import * as browser from '@angular/platform-browser';
import * as browserd from '@angular/platform-browser-dynamic';
import {isDevMode} from "@angular/core";
if (isDevMode()) {
  window['@angular/core'] = core;
  window['@angular/common'] = common;
  window['@angular/compiler'] = compiler;
  window['@angular/platform-browser'] = browser;
  window['@angular/platform-browser-dynamic'] = browserd;
}
Then include this file by importing it from any of your existing modules—typically main.ts:
import './globals';
With that in place, you can reach the desired exports from the console whenever you need them:
window['@angular/core'].ApplicationRef
If there are additional modules you’d like to inspect later, simply add them to globals.ts and they’ll be available as well.
This auxiliary-file approach works consistently whether your app is built on SystemJS or Webpack.
Switching on debugging details
By default, Angular operates in development mode. You’ll notice this from the console message:
Angular is running in the development mode. Call enableProdMode() to enable the production mode.`
To disable debugging information, you switch Angular to production mode with the enableProdMode function:
import {enableProdMode} from '@angular/core';

enableProdMode();
Production mode causes Angular to skip a host of operations. Among the things it omits are:
- adding attributes such as ng-reflect-…
- emitting important warnings, including the one about stripped HTML content
- constructing the debugging elements tree (discussed shortly)
- and more
Additionally, in development mode ApplicationRef.tick()
performs a second change detection cycle to ensure that no further changes are detected. If additional changes are picked up during this second cycle, bindings in the app have side-effects that cannot be resolved in a single change detection pass. In this case, Angular throws an error, since an Angular application can only have one change detection pass during which all change detection must complete
This makes it critical to switch modes appropriately during development and prior to deployment.
How the debugger is built internally
Angular relies on platform-specific Renderers to interact with the DOM. In the browser, DefaultDomRenderer is the primary class for DOM manipulation. When the framework runs in development mode, it also employs DebugRenderer, which attaches debug-specific data to nodes while delegating actual DOM operations to the default renderer. In production mode, DebugRenderer is absent.
For every DOM element in a View, Angular creates a corresponding DebugElement that holds debugging metadata. This debug element tree mirrors the rendered DOM structure closely. All these peer debug elements are stored in the _nativeNodeToDebugNode map, using the native DOM element as the key. When you call ng.probe(element) in the console, it retrieves the matching debug element as a DebugNode from this map. The DebugNode interface defines the public API for DebugContext, which itself mainly wraps a View. I have touched on views in my earlier pieces, Exploring Angular DOM manipulation techniques and Everything you need to know about change detection.
Using ng.probe to inspect what’s available
Angular exposes a global ng.probe function that accepts a native DOM element and returns its peer debug element. As mentioned, DebugElement implements the DebugNode interface, which offers this public API:
class DebugNode {
  nativeNode: any
  listeners: EventListener[]
  parent: DebugElement
  injector: Injector
  componentInstance: any
  context: any
}
Let’s look at what each of these properties contains and how you can leverage them.
nativeNode
This property keeps a reference to the original DOM peer element.
listeners
This holds the listeners attached to the native DOM peer element. Say you have a component defined like this:
@Component({
  template: `<span (click)="onClick()"></span>`
})
class MyComponent {
  onClick() { console.log('clicked')  };
}
If you pass the span reference to ng.probe, the listeners array will include one entry. When needed, you can manually invoke the event handlers registered for an event:
ng.probe($0).triggerEventHandler('click');
parent
Because the debug element hierarchy mirrors the DOM tree up to the root component, you can navigate upward using this property. If your HTML looks like this:
<h1 class="outer">
    <span class="inner">some</span>
</h1>
the debug elements will follow the same arrangement:
var h1 = document.querySelector('.outer')
var span = document.querySelector('.inner');
ng.probe(span).parent.nativeElement === h1;
injector
This creates and returns access to the component injector. It lets you reach every provider on the component injector as well as those on parent injectors. For instance, given this setup:
@Component({
  selector: 'my-app',
  providers: [
    {
      provide: 'MyAppProviderToken',
      useValue: 'MyAppProviderValue'
    }
  ],
  template: `<app-literals></app-literals>`
})
class MyApp {}


@Component({
  selector: 'a-comp',
  template: `<span class="a-comp-span">A component</span>`,
  providers: [
    {
      provide: 'AppLiteralsProviderToken',
      useValue: 'AppLiteralsProviderValue'
    }
  ]
})
class AComp {}
you can retrieve both AppLiteralsProviderToken and the parent component token MyAppProviderToken:
let span = document.querySelector('.a-comp-span');

// "AppLiteralsProviderValue
ng.probe(span).injector.get('AppLiteralsProviderToken');

// MyAppProviderValue
ng.probe(span).injector.get('MyAppProviderToken');
componentInstance
This holds the instantiated class instance of the component. If you define a component like so:
@Component({
  template: `
      <h1 class="outer">
          <span class="inner">some</span>
      </h1>
  `
})
class MyComponent {
  name = 'C';
}
the component instance will contain an object of the MyComponent class:
let debugNode = ng.probe($0);
debugNode.componentInstance.name; // 'C'
When you select elements that are part of the same component view, they all share the same component instance:
var h1 = document.querySelector('.outer')
var span = document.querySelector('.inner');

ng.probe(h1).componentInstance === ng.probe(span).componentInstance
There are times when you might want to modify properties on the component instance.
debugNode.componentInstance.name = 'V';
If those properties are bound in templates, you’ll observe the view reflect changes during the next digest cycle. But you can also force updates on demand, which I’ll demonstrate further down.
context
This holds the data model used by the component or an embedded view. For component views, this property points back to the component instance. For embedded views—such as those generated by ngFor—it contains internal data like index, first, last, and so on. Consider this template:
<li *ngFor="let item of items; let i = index">
    <span>{{i}}</span>
</li>
the context for the inner span reveals this:

This property comes in handy when debugging structural directives that establish their own context, like ngFor.
Running a change detection cycle by hand
When debugging tools are active, you can simply execute:
ng.profiler.timeChangeDetection();
As you might recall, this method triggers change detection starting from the application root.
Another route is to obtain the ApplicationRef and invoke its tick method. ApplicationRef lives in the root module’s injector, which is used to bootstrap the app. Because Angular returns the bootstrapped module reference from bootstrapModule, you can access that injector:
let platform = platformBrowserDynamic();
platform.bootstrapModule(AppModule).then((module) => {
  let injector = module.injector;
});
ApplicationRef is stored in the injector using its class reference as the key. Here’s how to access the Application instance:
import {ApplicationRef} from "@angular/core";

platform.bootstrapModule(AppModule).then((module) => {
  let application = module.injector.get(ApplicationRef);
});
However, you can’t reach this application variable from the console unless you expose it as a global:
window.application = module.injector.get(ApplicationRef);
Fortunately, injectors form a hierarchy, so you can reach values in the root injector from any child injector. Since Angular registers the ApplicationRef class reference in the coreTokens global variable, here’s how to run change detection manually with ng.probe and a child injector:
ng.probe($0).injector.get(ng.coreTokens.ApplicationRef).tick();
Leveraging debugging tools
Angular also includes a set of debugging utilities. Don’t confuse these with the debugging information available via ng.probe. These tools work regardless of whether Angular runs in development or production mode. You activate them by calling enableDebugTools, which is exported from the platform-browser module. This function takes a ComponentRef and uses it to access the ApplicationRef. You can enable these tools either within your code:
platform.bootstrapModule(AppModule).then((module) => {
  let applicationRef = module.injector.get(ApplicationRef);
  let appComponent = applicationRef.components[0];
  enableDebugTools(appComponent);
});
or from the console of a live application.
System.import("@angular/platform-browser").then(function(module) {
  enableDebugTools = module.enableDebugTools;
  disableDebugTools = module.disableDebugTools;
});
var componentRef = ng.probe($0);
enableDebugTools(componentRef);
The only requirement is a reference to any component to pass into enableDebugTools. To get that reference in the console, you either expose it from one of your modules or rely on ng.probe.
In Angular 4.x.x, there’s just one debugging tool provided—the profiler. Currently, its sole function is to measure change detection time. Here’s what Angular says about it:
Exercises change detection in a loop and then prints the average amount of
time in milliseconds how long a single round of change detection takes for
the current state of the UI. It runs a minimum of 5 rounds for a minimum of 500 milliseconds.
You access it in the console through the global variable ng.profiler:
ng.profiler.timeChangeDetection();
It repeatedly runs change detection cycles from the root component and computes the average duration per cycle. The profiler presents this data in this format:
ran 5 change detection cycles
platform-browser.umd.js:4326 4480.59 ms per check
You can also trigger a CPU profile in the Profiles tab of your browser by supplying the {record:true} parameter:
ng.profiler.timeChangeDetection({record:true});

And that wraps it up!