Tracing the Source of Webpack's Vague Build Failures
Lately, I've been integrating a variety of plugins into our Webpack-based build pipeline. In their current state, most of these plugins come with sparse documentation, which naturally leads to incorrect setups and, as a result, errors during the build. This is, of course, all part of the learning curve and shouldn't be a significant issue on its own. The real hurdle, however, is that Webpack currently doesn't provide precise information about where an error occurs. Consequently, I often encountered the following kind of ambiguous failures:
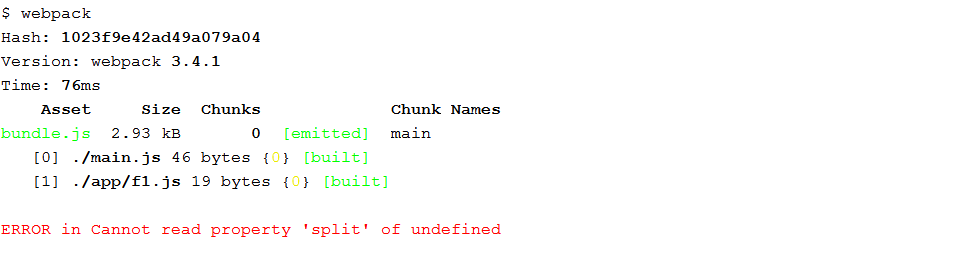
Webpack successfully identifies that an error exists and reports it, but it leaves you completely in the dark about its origin. If you don't know where to start, tracking down this error can eat up days. Your only option would be to disable plugins one at a time to isolate the culprit, which is both tedious and ineffective.
This guide demonstrates a straightforward method to quickly locate the source of such errors. It's a handy trick that could potentially save you a significant amount of time. It proved to be a lifesaver when I was setting up the ngtools/webpack AOT plugin for use outside of angular-cli, and I'm confident it will be just as helpful for you.
Introducing the HelloWorldCheckerPlugin
Before we dive into debugging, it's helpful to see how these vague errors can arise in the first place. To do that, we'll create a simple plugin that takes a file path as a configuration option and verifies if that file contains the string Hello World!. After the check, it merely logs the result to the console.
plugins: [
   new HelloWorldCheckerPlugin({path: 'toinspect.txt'})
]
At first glance, setting up this plugin seems trivial. But let's say the plugin's author didn't clarify that it requires the absolute path to the file, not the relative path. This is a frequent scenario, as developers often build a plugin for their own internal use and later push it to GitHub without formalizing implicit assumptions into proper documentation. The result is often incomplete or missing instructions.
The plugin appears straightforward to configure, but what if the author failed to mention it needs the absolute file path, not a relative one? It's quite common to develop a plugin for personal use first and then publish it publicly. In such cases, the documentation, if it exists at all, may leave out details the author knows by heart and considers obvious.
So, here is how our plugin implementation looks:
const fs = require('fs');
const path = require('path');

class HelloWorldCheckerPlugin {
    constructor(options) {
        this.options = options;
    }

    apply(compiler) {
        compiler.plugin('make', (compilation, cb) => this._make(compilation, cb));
    }

    _make(compilation, cb) {
        try {
            const file = fs.readFileSync(path.resolve('/', this.options.path), 'utf8');
            if (file.includes('Hello World!')) {
                console.log(`The file ${this.options.path} contains 'Hello World!' string`);
            } else {
                console.log(`The file ${this.options.path} doesn't contain 'Hello World!' string`)
            }
            cb();
        } catch (e) {
            compilation.errors.push(e);
            cb();
        }
    }
}

exports.HelloWorldCheckerPlugin = HelloWorldCheckerPlugin;
We simply tap into the make phase of the compilation process and execute the check within the _make method. The line below shows that the current implementation expects an absolute path to the file:
fs.readFileSync(path.resolve('/', this.options.path), 'utf8');
Now, imagine you've downloaded this plugin and set it up with a relative path in your configuration:
const HelloWorldCheckerPlugin = require('./plugin').HelloWorldCheckerPlugin;
const path = require('path');

module.exports = {
    entry: "./main",
    output: {
        path: __dirname + "/dist",
        filename: "bundle.js"
    },
    plugins: [
        new HelloWorldCheckerPlugin({path: 'toinspect.txt'})
    ]
};
When you execute webpack, you are met with that ambiguous error message:
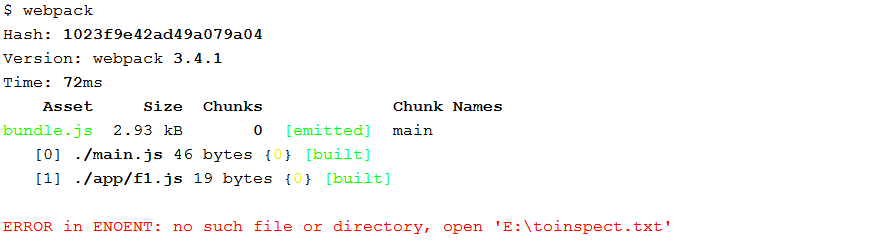
In this instance, it might be apparent that the issue lies within HelloWorldCheckerPlugin. However, consider these scenarios:
- the error is as non-descriptive as the one shown in the introduction
- you have over ten plugins configured, several of which might use a
toinspect.txtfile - the
toinspect.txtfile isn't just used by the plugin; it's also imported by various JavaScript modules in your bundle
Suddenly, you're at a standstill, unsure where to even begin. It would be helpful if webpack could at least point to the filename where the error occurred. But as we'll discover, that's not truly feasible with webpack's current architecture. It seems the responsibility falls on the plugin author to provide the necessary error context for troubleshooting.
The Role of Compilation Errors
It's crucial to remember that webpack collects all errors that occur during the compilation process in an array called Compilation.errors:
class Compilation extends Tapable {
   constructor(compiler) {
      super();
        ...
      this.errors = [];
   }
}
The expectation is that any plugin encountering an error will populate this array. Our aptly named HelloWorldCheckerPlugin adheres to this convention by adding its error to the array:
_make(compilation, cb) {
    try {
       ...
    } catch (e) {
        compilation.errors.push(e);
        cb();
    }
}
So, to understand the source of our vague error, we only need to intercept the call to the push method and examine the call stack. That will reveal the exact location where the error gets added to the array. Let's put this plan into action.
How to Intercept `push` on the Errors Array
For this debugging session, I'm using Chrome to debug Node scripts, but this method works with any Node debugger. I prefer Chrome because it performs significantly faster than the built-in Node debugger in Webstorm. You can check this article for guidance on using Chrome with Node scripts.
As the article explains, to start debugging Node with Chrome, you run node with the --inspect flag. I'm using a variation, --inspect-brk, which pauses execution at the very first statement. This pause gives me a window to set up breakpoints in other files. To launch webpack in debug mode, we run:
node --inspect-brk node_modules/webpack/bin/webpack.js
I often set up an alias, like dlwpc (short for debug local webpack), so I can debug webpack from any directory where it's installed:
alias dlwpc="node --inspect-brk node_modules/webpack/bin/webpack.js"
Now, to intercept the push call, we'll replace the following:
this.errors = []
with this:
this.errors.push = ()=> { Array.prototype.push.call(this, arguments); debugger }
This ensures that whenever push is invoked, the execution will pause, allowing us to trace the call back to its origin. There's no need to modify the webpack source permanently. We can use the console to make this change on the fly. So, let's start webpack in debug mode:
$ dlwpc
As per the article, we then navigate to
chrome://inspect
and select inspect from the Remote Target section:
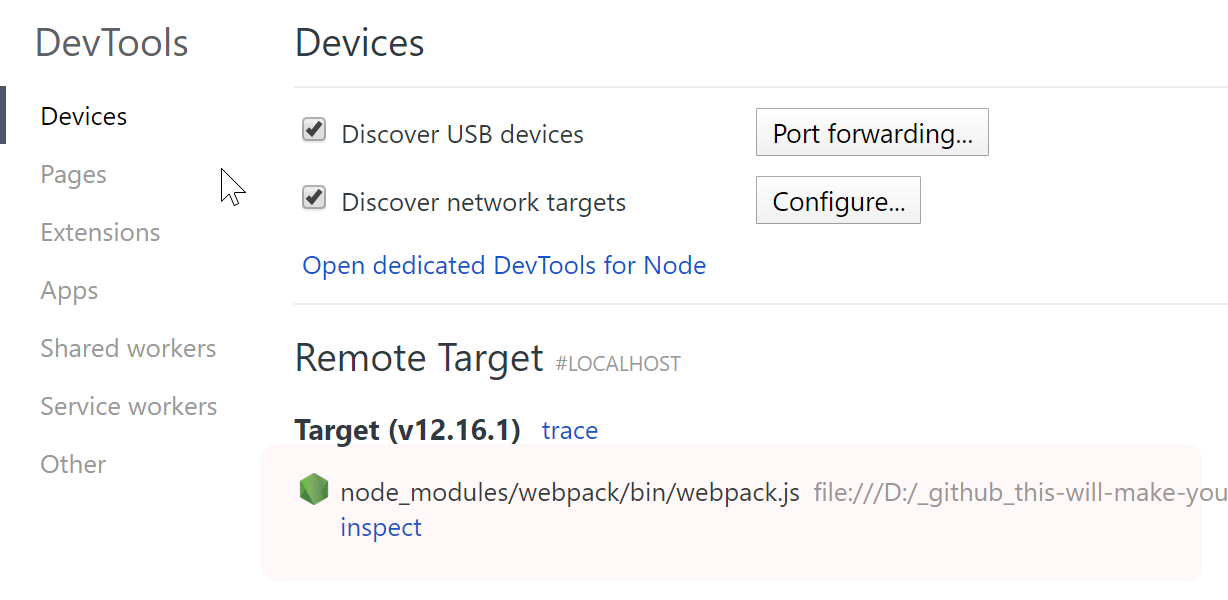
It might take a few seconds for the target to show up, so be patient. Once you click on it, a dedicated Chrome Developer Tools window will open, paused on the first statement:
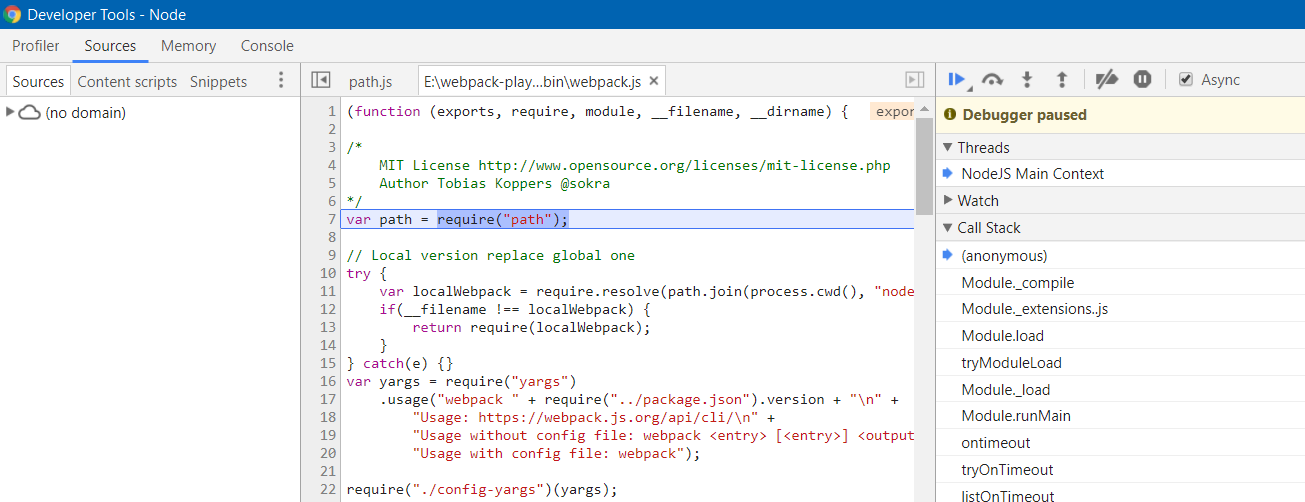
We need to access the Compilation class, located in the node_modules/webpack/lib/Compilation.js file, but it's not available yet since Chrome hasn't loaded it. You have a few options:
- Insert a
debuggerstatement in the constructor of theCompilationclass within the source files. This is the least convenient because you'll have to clean them up afterward, but I sometimes resort to it when I have the source open and want a quick pause. - Manually upload Webpack files from the file system. This is often the most convenient, but it's not always foolproof. When you're debugging a single package, it's easy to locate and upload it. However, with multiple packages in play, it's hard to know which ones you need, and uploading the entire
node_modulesdirectory isn't realistic. Also, the file might be located somewhere else entirely. - Let Webpack run to completion once. The inspector will then have loaded and retained all the files used during that execution. You can then open the file you need and set a breakpoint. This is another method I use frequently.
Let's walk through the second and third options.
Letting Webpack Finish Once
To run Webpack for the first time, I set a breakpoint near the end of the main webpack.js file:
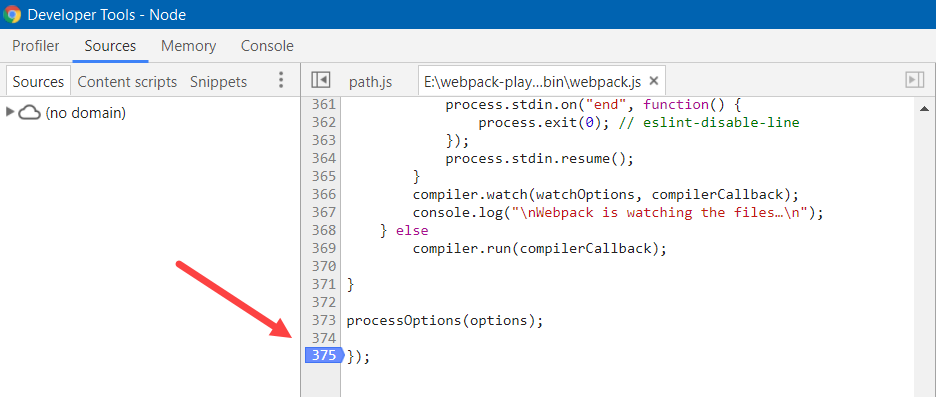
Then, I press Resume script execution (F8) and wait for it to hit the breakpoint. At this stage, all files used during the run have been loaded, so I can use Ctrl+P on Windows to quickly open the file containing the Compilation class:
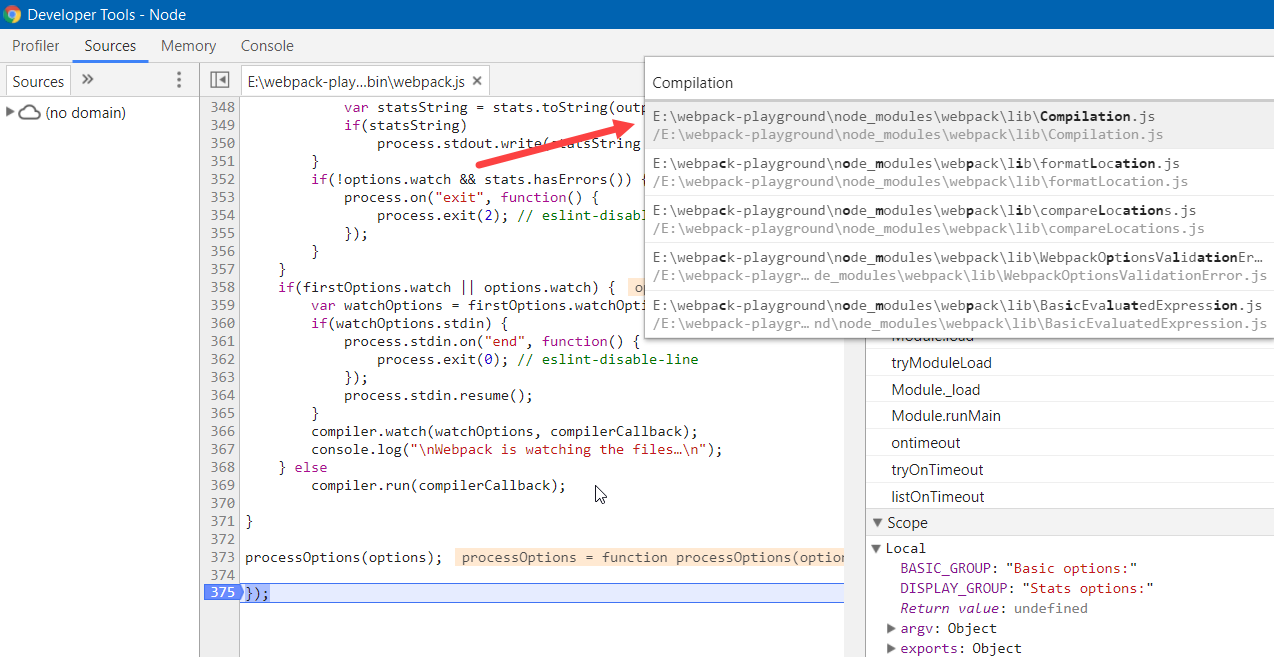
I then set a breakpoint after this.errors=[] is initialized:
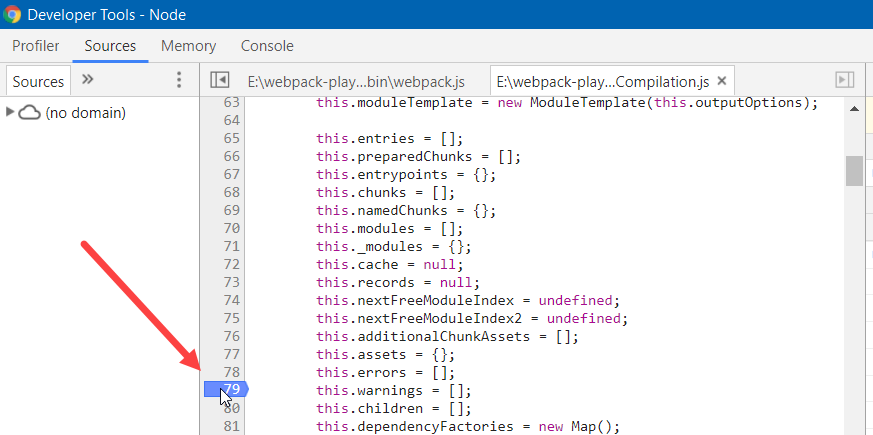
Since Webpack has already processed this file, restart webpack. When you resume execution, the debugger should pause at this breakpoint. I've noticed Chrome sometimes doesn't retain breakpoints from a previous session, so you might need to run Webpack a couple of times or fall back to the debugger statement approach.
Uploading Webpack Source Files
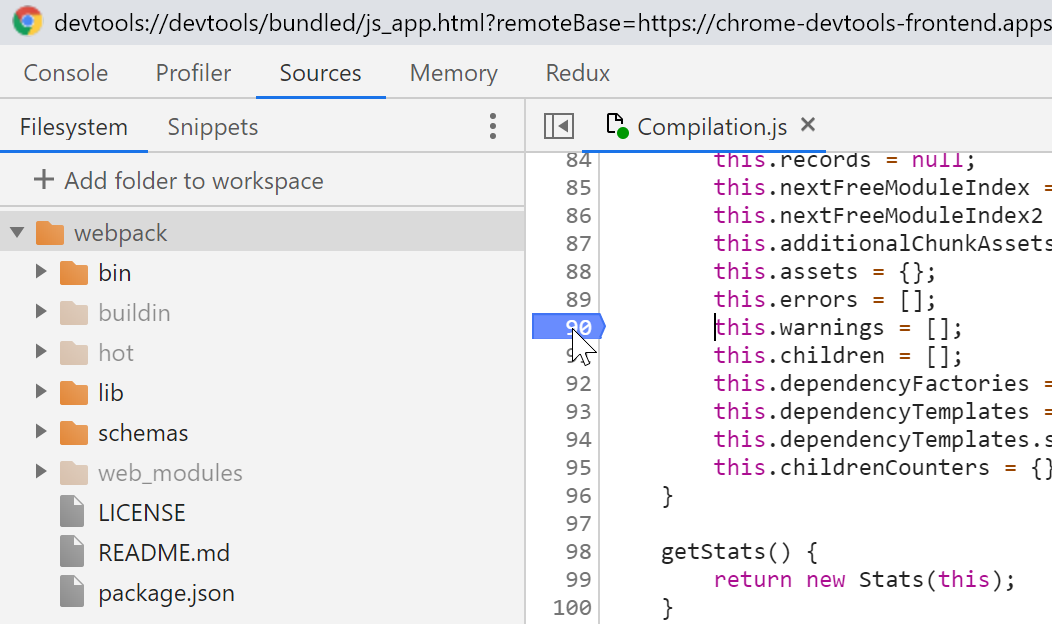
To upload the Webpack files, navigate to the Sources tab and then the Filesystem section. Click on Add folder to workspace and choose the webpack module from your file system:

After this, the Compilation class becomes accessible. You can open it

and place a breakpoint right there:
Customizing the errors Array
Now that the execution is paused at the breakpoint, we need to swap out this.errors with our custom object. As mentioned, we'll do this in the console.
I open the console by pressing the escape key Esc on Windows. If that doesn't work for you, check the documentation. The key is to replace this.errors with a custom object before any code attempts to write to it.
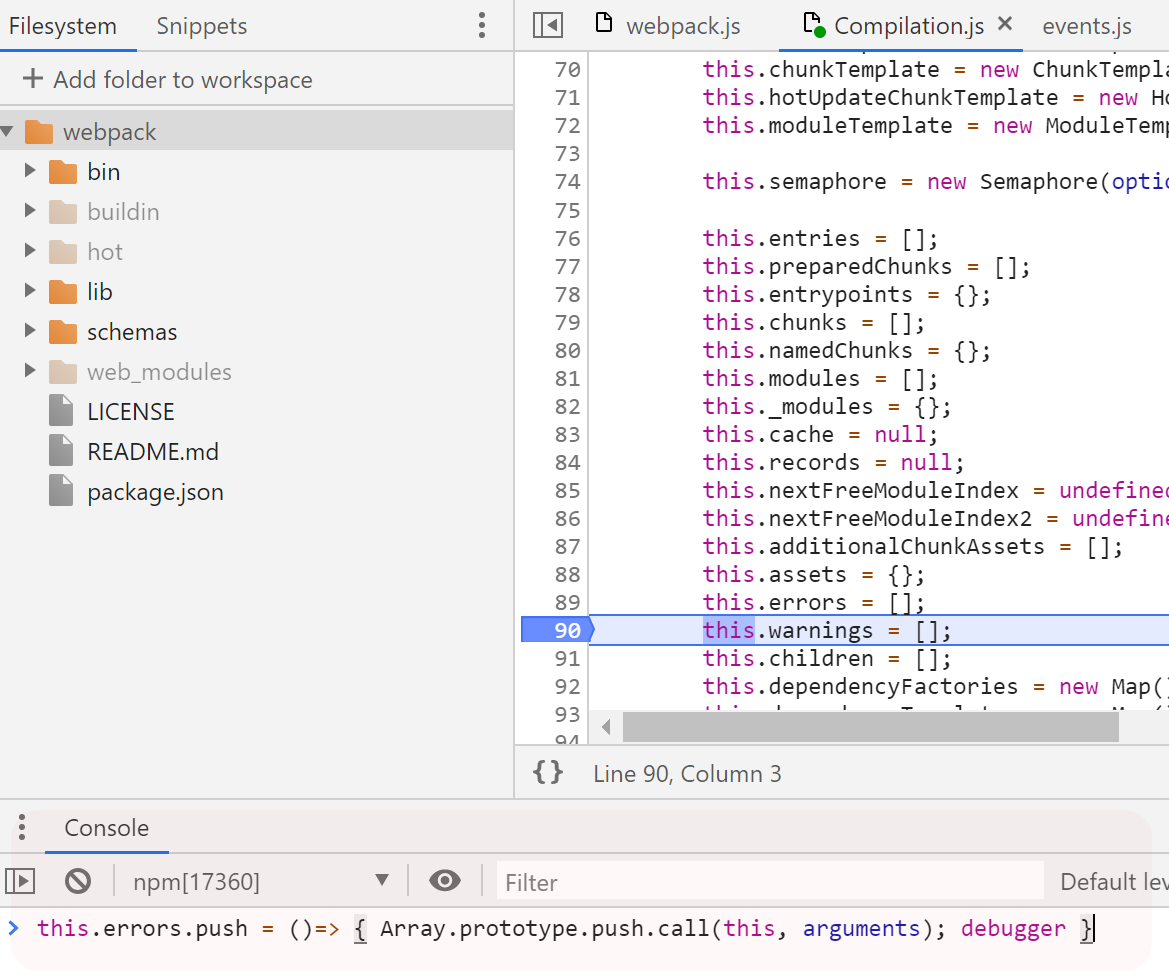
With that done, let's simply resume execution and see what happens. The debugger stops, and the callstack clearly shows me where the error originates:

If I click on plugin.js:22 in the callstack, I can see our plugin adding the error to the array:
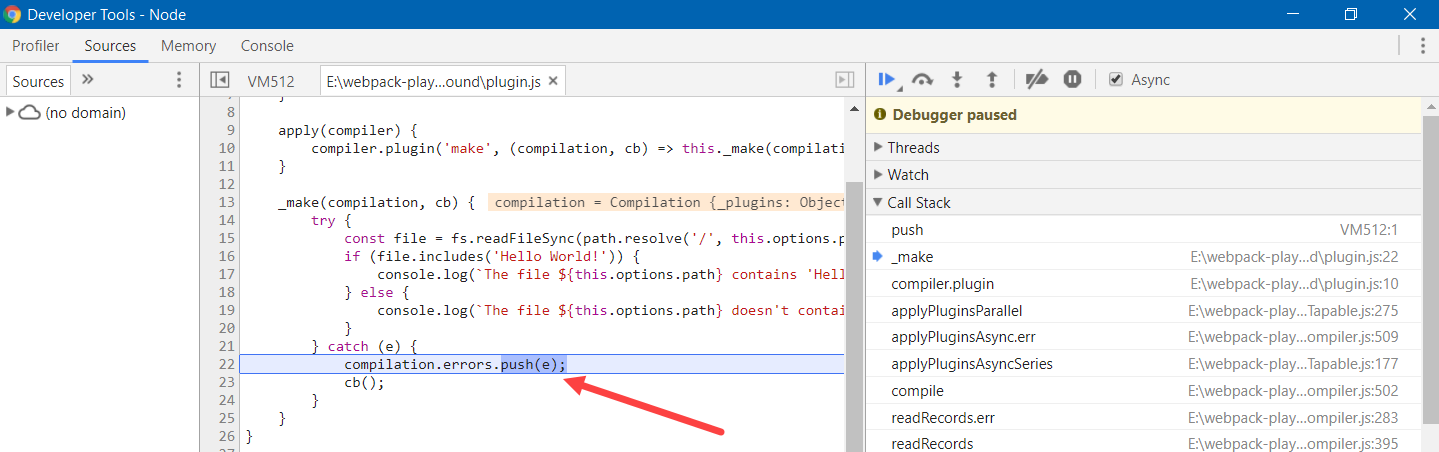
There it is! We've successfully pinpointed the source of the error. Now we know exactly where it's coming from, allowing us to tweak our configuration or dive into the plugin's source code to see what we did wrong.
Just to demonstrate that our plugin is properly implemented, let's provide an absolute path:
plugins: [
    new HelloWorldCheckerPlugin({path: path.resolve(__dirname, 'toinspect.txt')})
]
Here's the result we get:
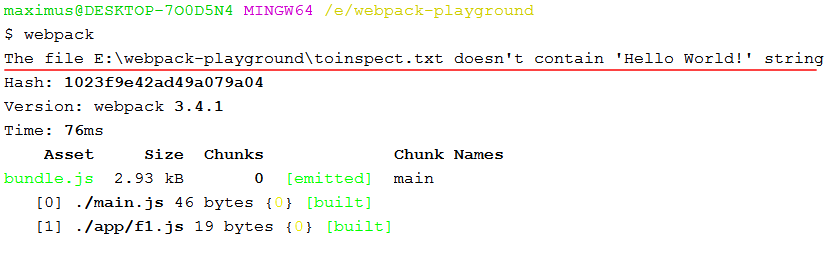
And that's all there is to it.
Find the Code on GitHub
If you'd like to experiment with this setup, I've created a GitHub repository for you. After you've cloned the repository, go to webpack.config.js and alter the path provided to the HelloWorldCheckerPlugin to trigger an error:
plugins: [
    new HelloWorldCheckerPlugin({path: 'toinspect.txt'})
]