This article is an excerpt from my course Change detection in Angular
There are times when you'll observe a change detection cycle firing without an obvious trigger. Identifying what caused it can be a challenge. Within Angular, change detection can be initiated by all sorts of browser events—user interactions, network responses, or timers. In a complex application, these events are so interwoven that isolating the specific trigger for a given cycle is rarely straightforward. This is precisely where the browser's built-in debugging tools become essential.
Chrome DevTools is an invaluable asset when you need to trace the sequence of operations that culminates in a change detection run. In this segment, I'll demonstrate how to leverage the callstack, logpoints, filtering, and local overrides features to identify the source of those unexpected change detection cycles.
We'll begin with a straightforward case. Picture a UI element rendered on the page. You notice that merely hovering over this element causes change detection to fire. This is a typical scenario when a third-party library has silently attached event listeners to the DOM elements it uses.
To replicate this situation, we can use the subsequent implementation:
@Component({
  selector: 'app-root',
  template: `
  <div (mouseover)="0">Just a plain div</div>
  <child-cmp></child-cmp>
 `,
})
export class AppComponent {}

@Component({
  selector: 'child-cmp',
  template: `
    <div>Changes detected: {{n}}</div>
    <button (click)="fetch()">Fetch</button>
  `,
})
export class ChildComponent {
  n = String(Date.now()).slice(-4);

  ngDoCheck() {
    this.n = String(Date.now()).slice(-4);
  }
}
Which appears like this:
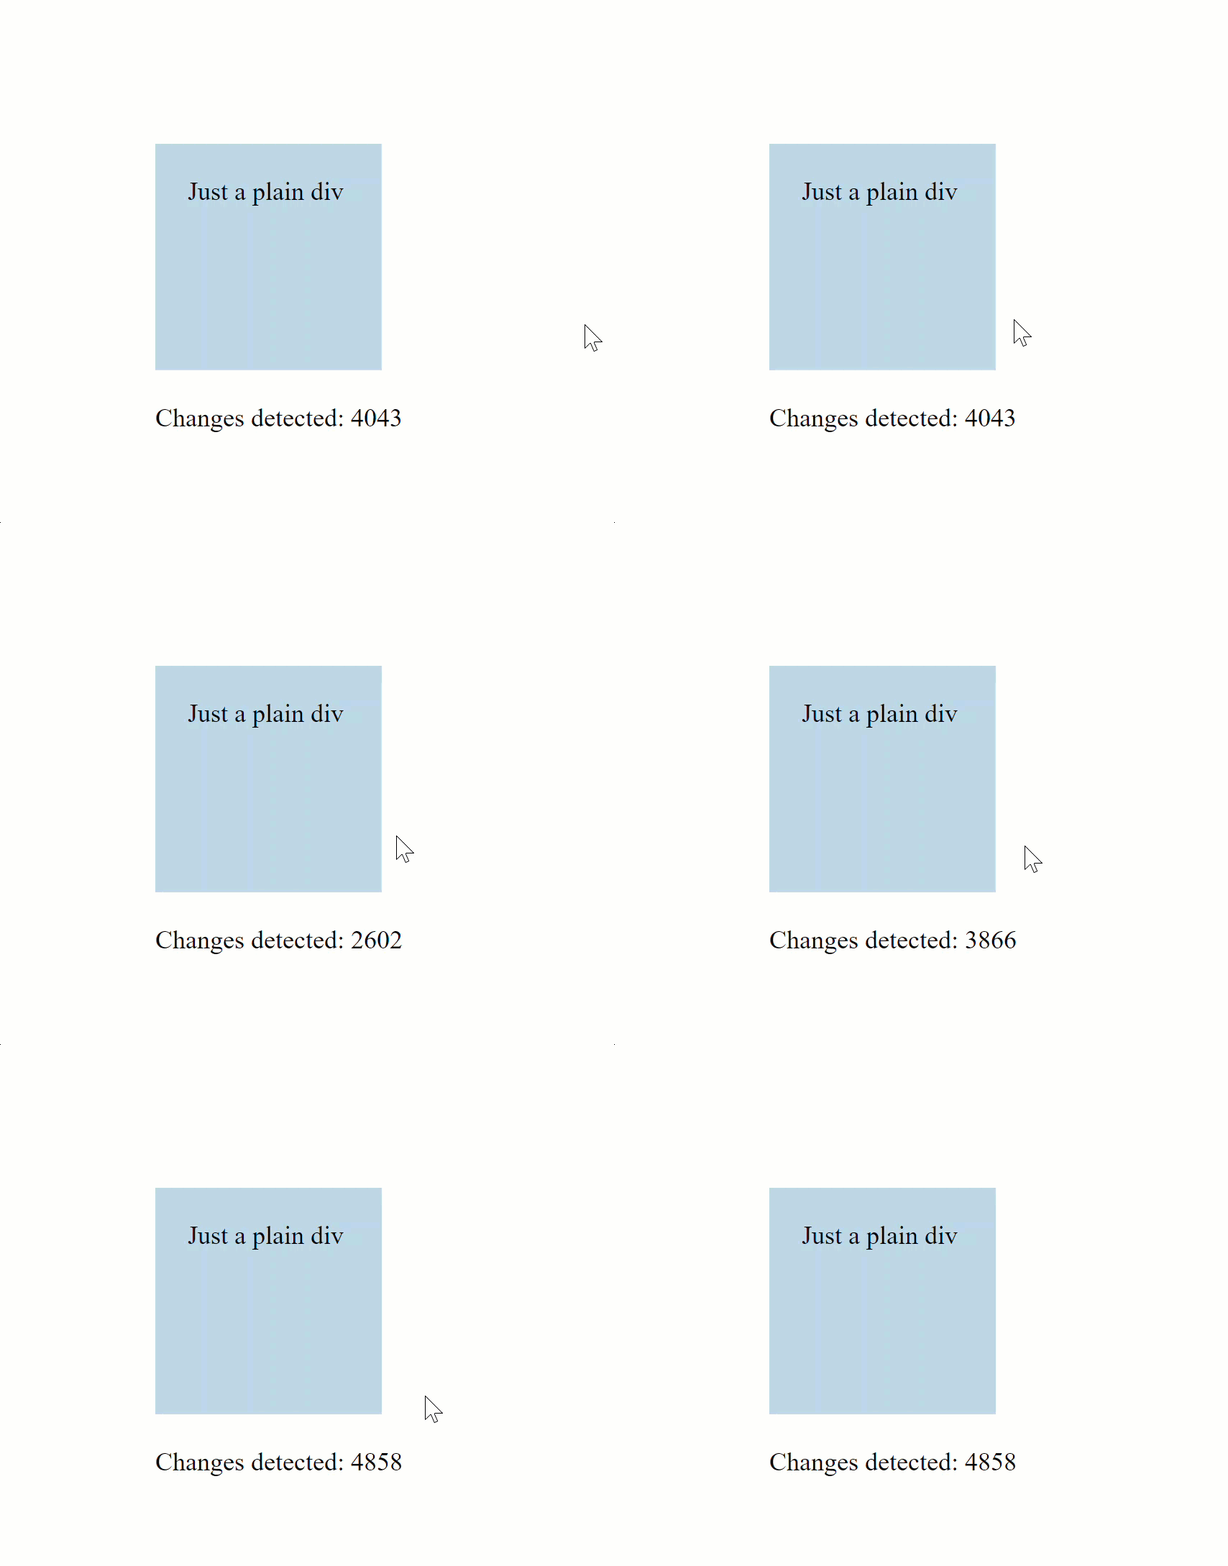
Let's imagine we have no prior knowledge of the mouseover listener that's causing the change detection. Our goal is to uncover it using the DevTools. Here's the process.
First, we need to halt the change detection process. We can do this by setting a breakpoint within the template function of the component that's being affected—in this case, ChildComponent.
Once the change detection is paused, the screen will look like this:
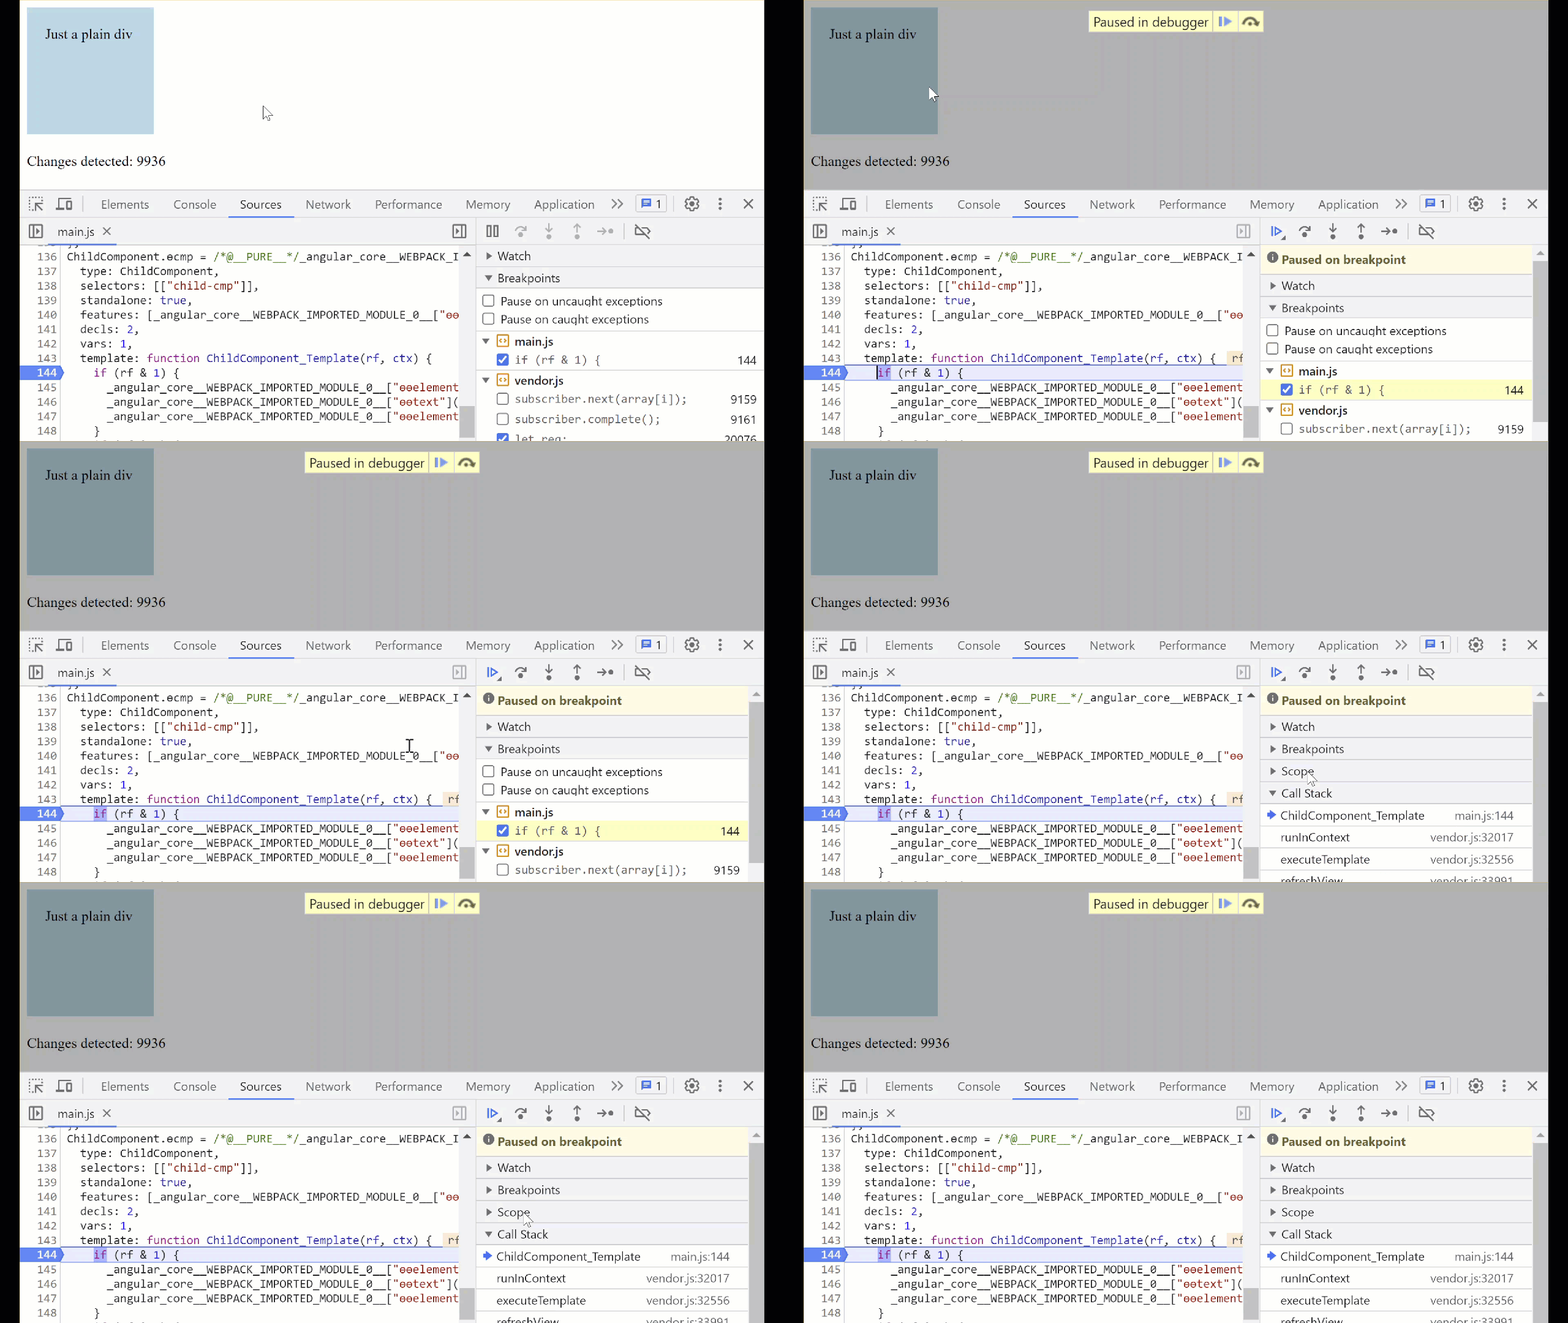
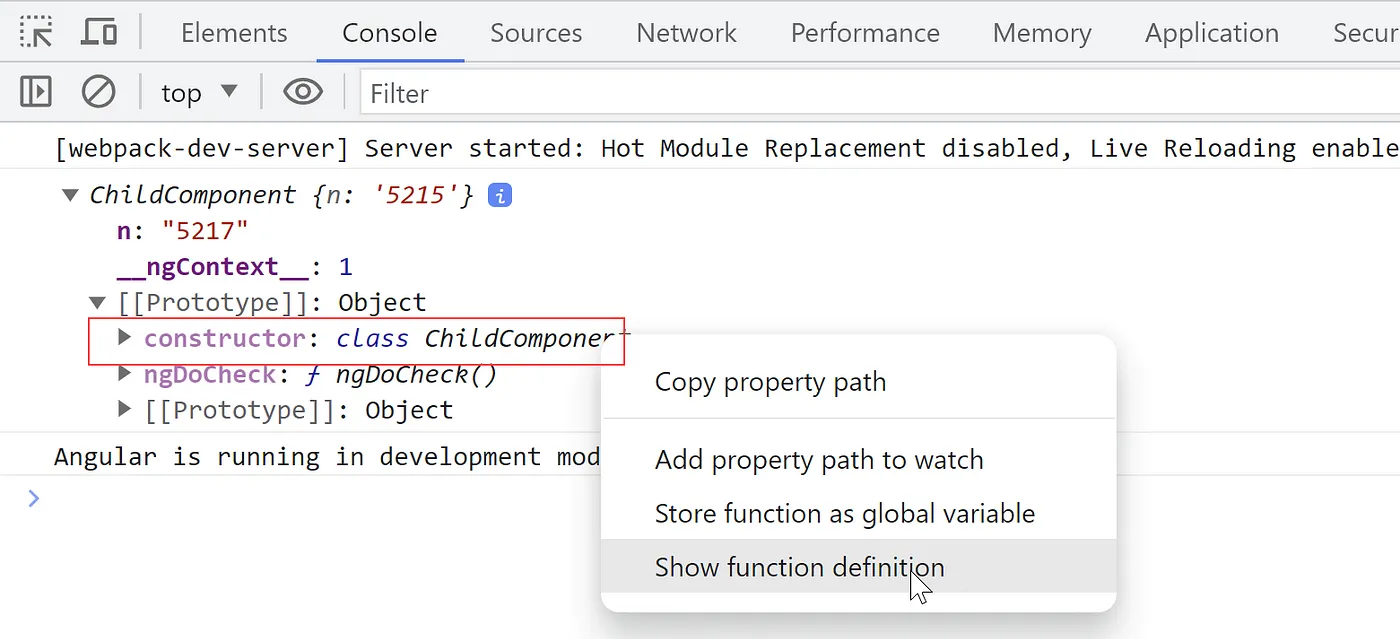
Your next step is to locate the component definition that the compiler generated in the Sources panel. If a global search doesn't help you find it, you can simply log the component instance to the console:
@Component({
  selector: 'child-cmp',
 ...
})
export class ChildComponent {
  constructor() {
    console.log(this)
  }
}
Then, use the "show function definition" feature, as shown below, to jump to the class definition:
The template function generated by Angular's compiler will be located directly below the component class:
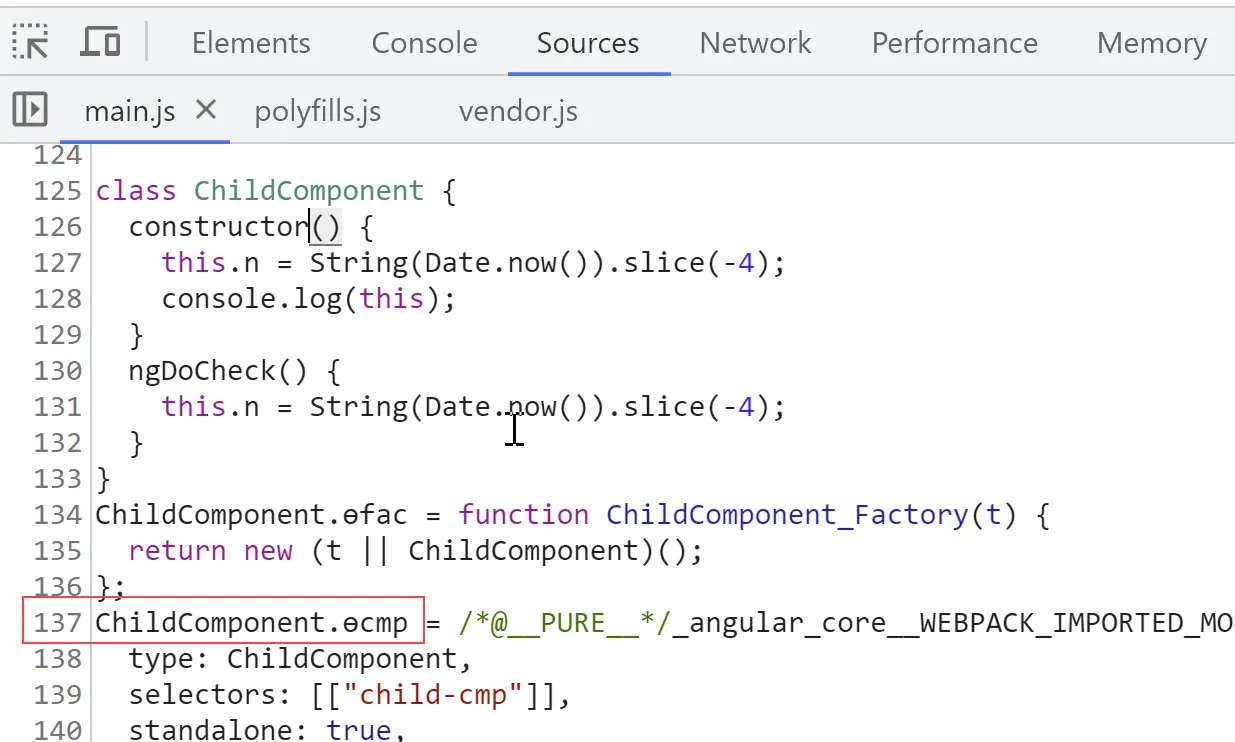
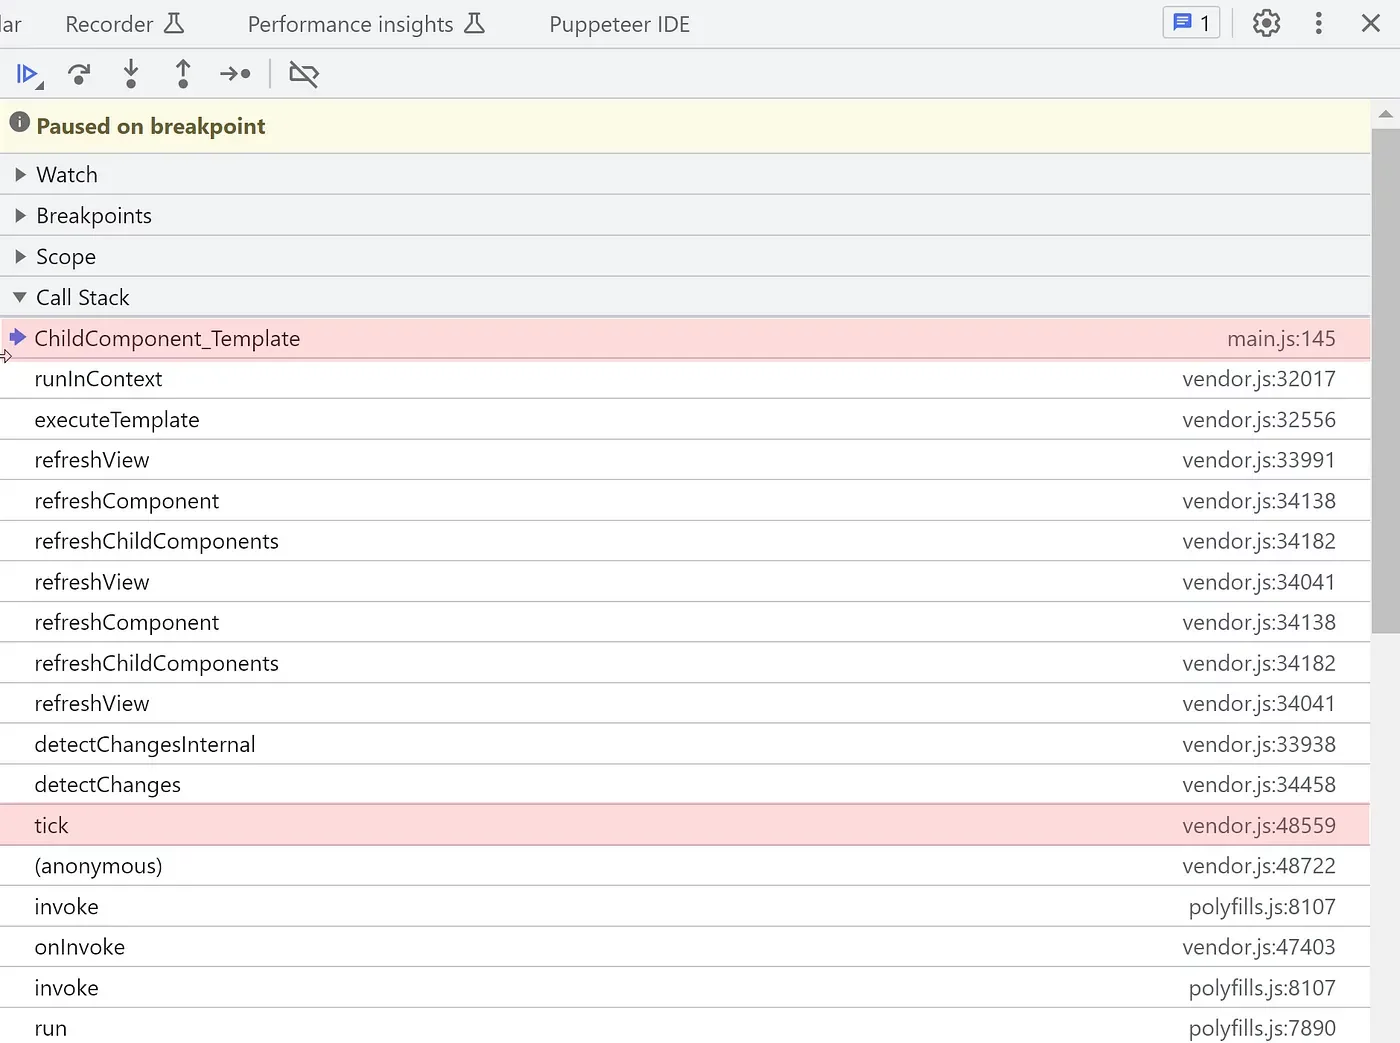
After placing a breakpoint in the template function, hover over the box. When the debugger pauses execution, we can look at the callstack. In this scenario, we observe that Angular is executing a full application-wide change detection that began from the tick function:
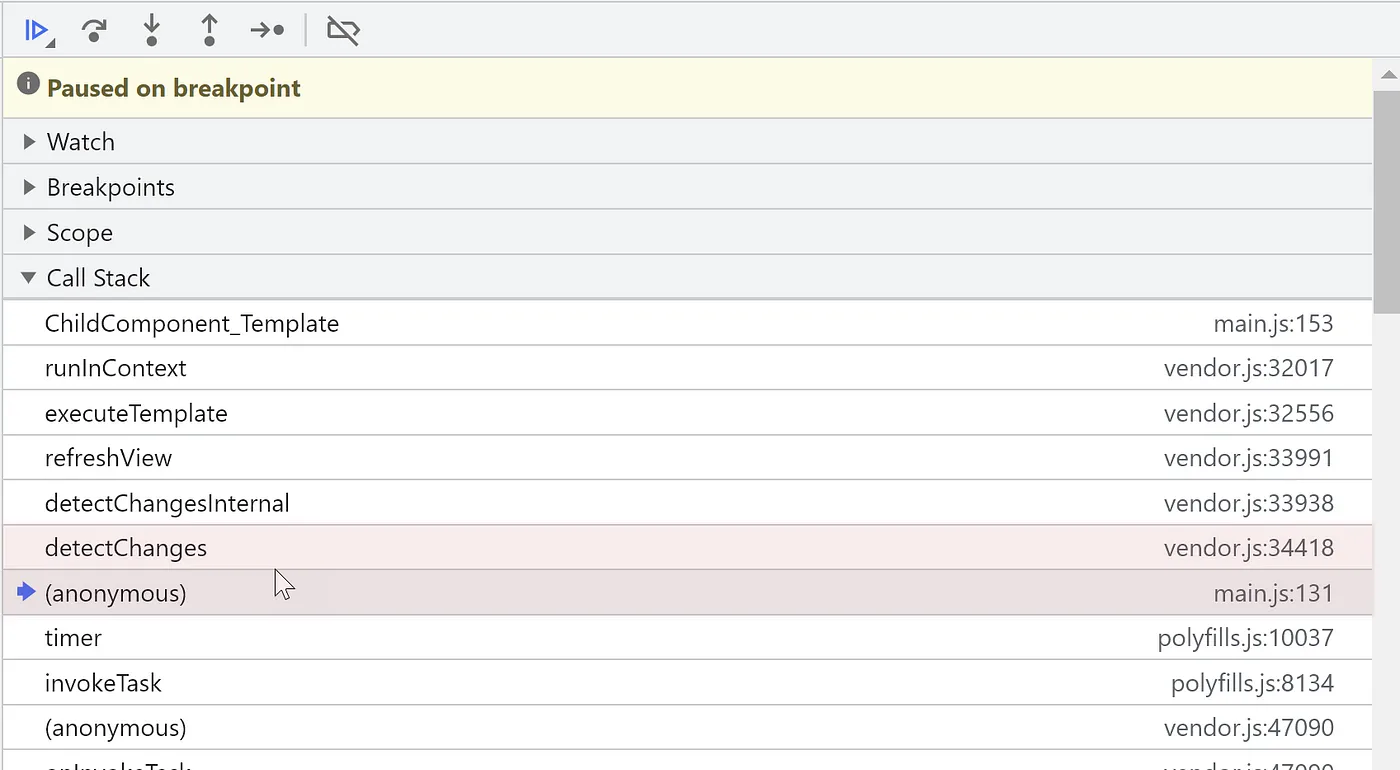
Had this been a local change detection run, the callstack would reveal the specific function that triggered it, rather than showing the tick method. For example, it might resemble this:
For a global change detection that starts with the tick function, we need to examine what occurred just before it was called. Specifically, we're interested in the event that AngularZone processes before executing its checkStable function and notifying Angular accordingly.
Given the callstack from our example, we should investigate the orange segment that appears prior to the tick method:
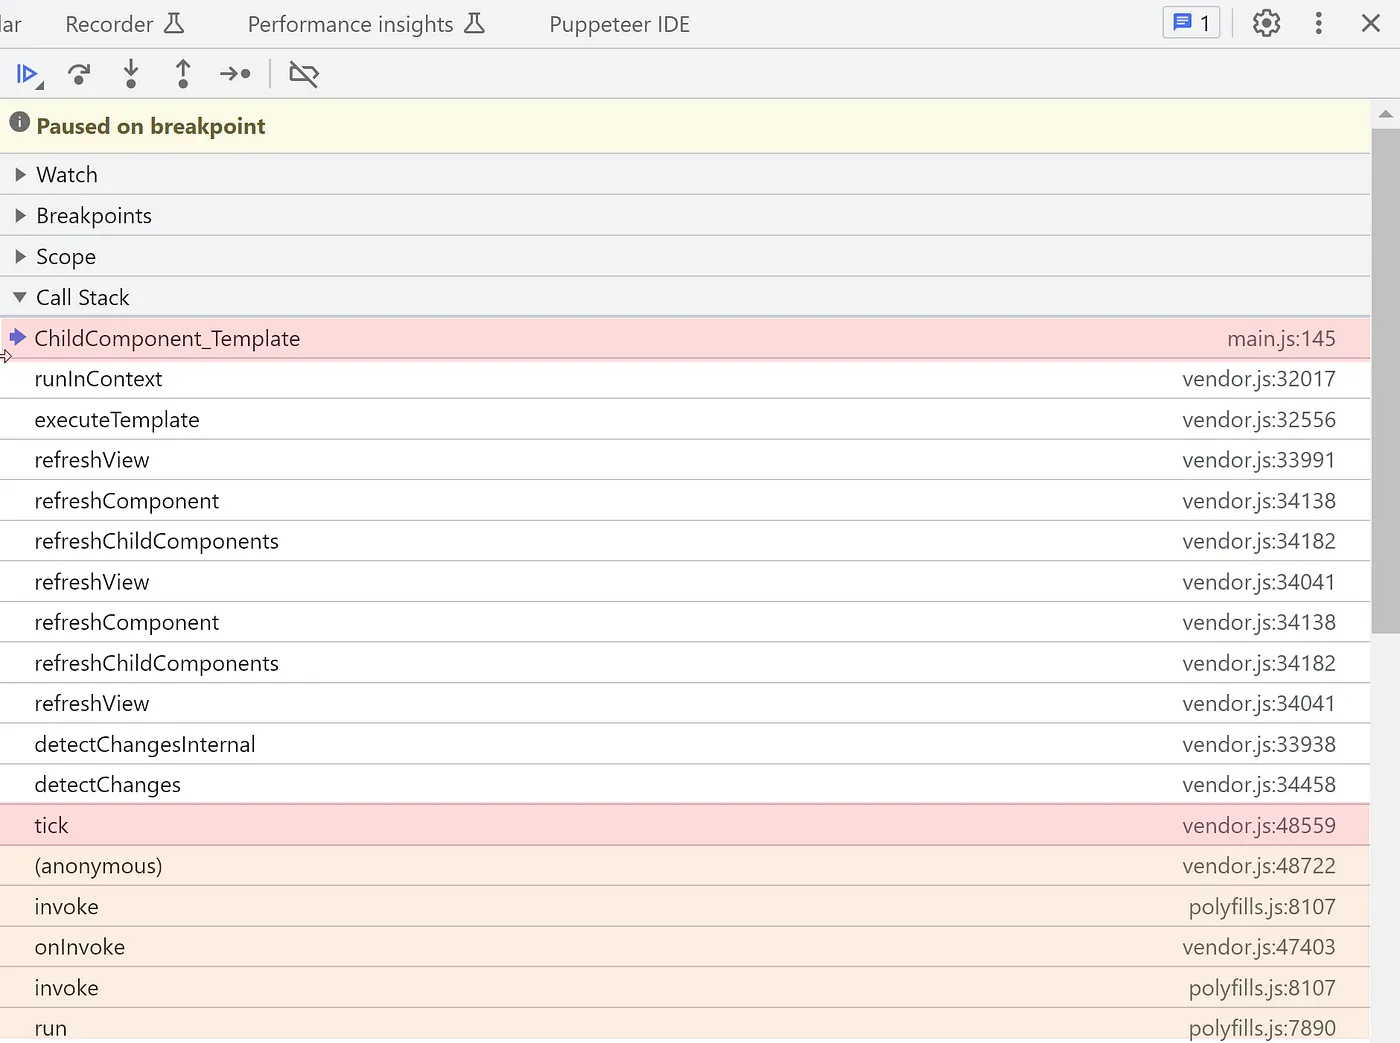
Our focus is on the event that ultimately triggers the call to tick. We can glean important details about the task from within the onInvokeTask callback. This is the callback that Zone.js invokes once a task has finished. Let's switch the execution context to that function by clicking on it in the callstack and then inspect the event data like this:

From this, it becomes quite evident that the mouseover event is what's causing the change detection.
Leveraging logpoints
In real-world applications, there might be dozens or even hundreds of events firing in quick succession, each potentially triggering change detection. Stopping execution to examine each one individually isn't practical. In such cases, using logpoints proves to be a far more effective strategy.
Our task is to log every event that flows through the Zone.js mechanism. Let's attach a logpoint to the runTask method as follows:

A zone task carries the following details:
- source — the name of the API that requested the task to be scheduled
- target — the event target, such as DOM elements for UI events
- eventName — the native event name, like click or mouseover
Let's start by creating a logpoint that captures both the eventName and target properties:
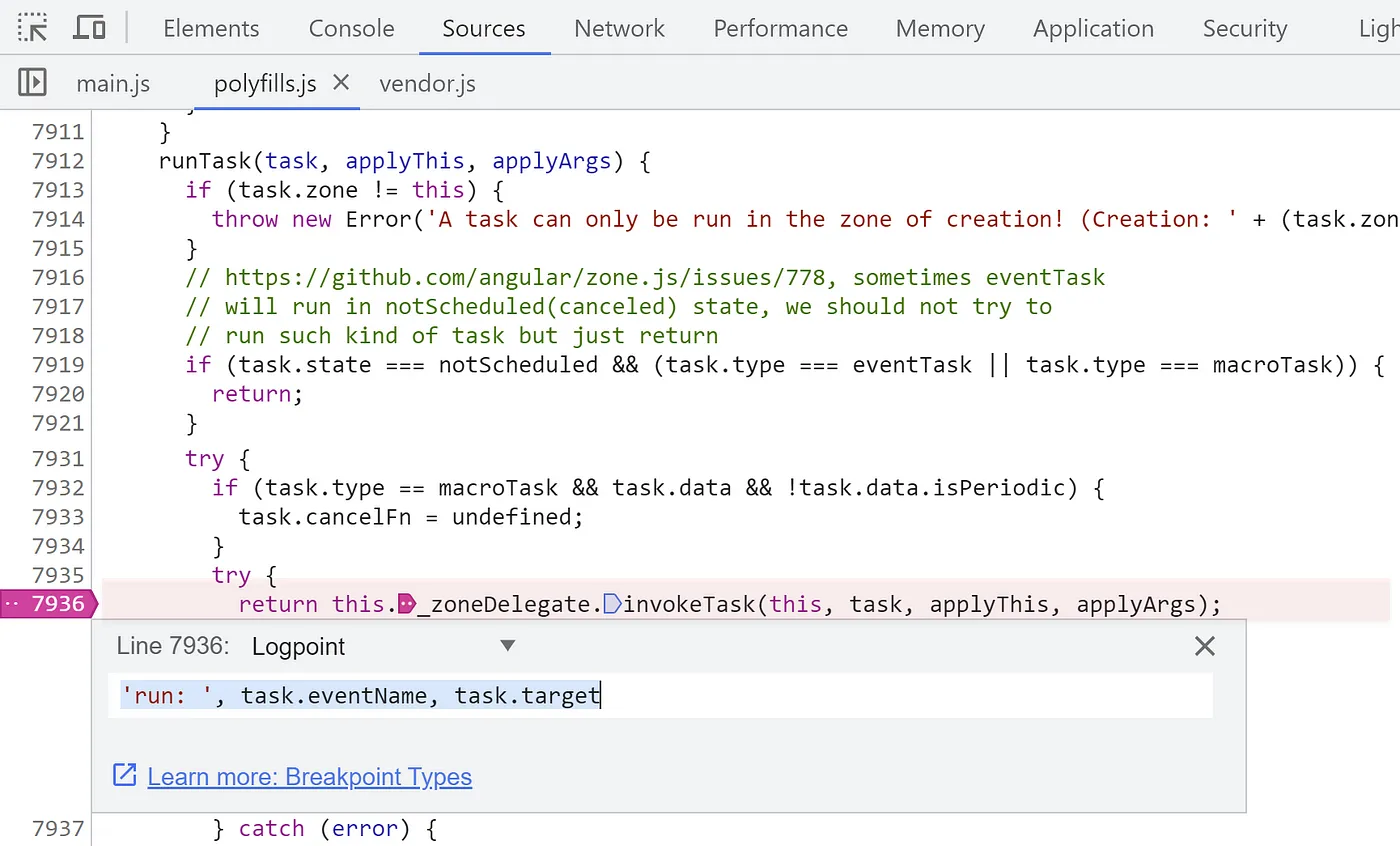
When we hover over the box on the page, this is what appears in the console:
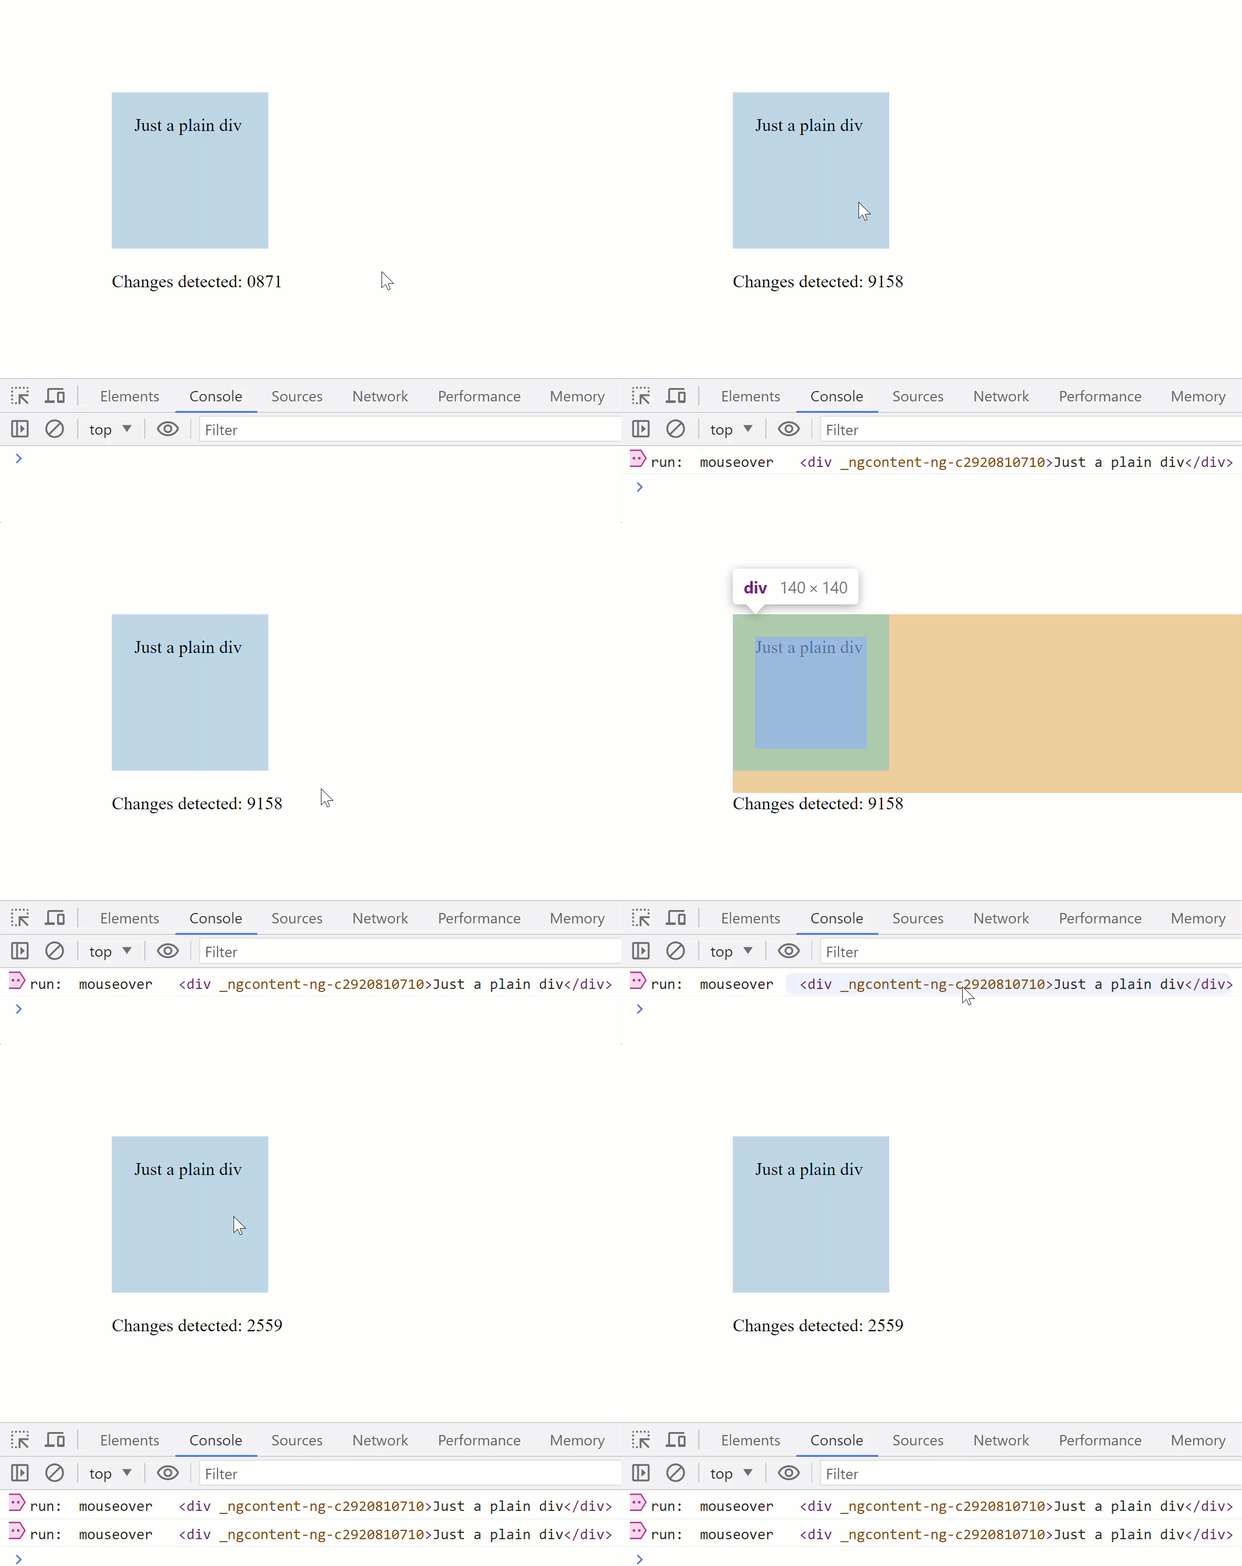
The logpoint clearly indicates that the event is mouseover and its target is the div element, which is our UI box.
We can also log the invocation of the tick method. This provides a clear indicator of when Angular is executing change detection:
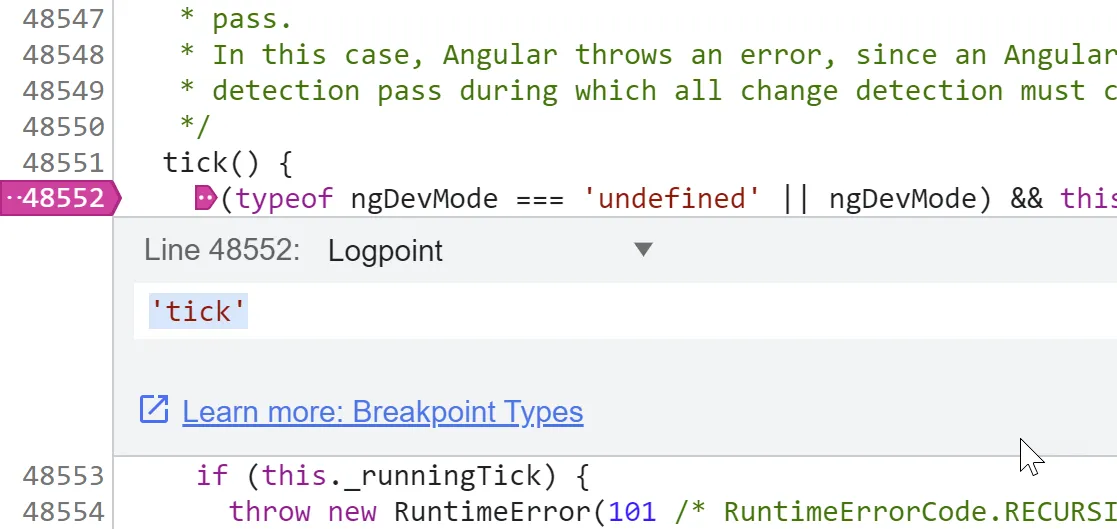
Now, upon hovering over the box, the console demonstrates the causal chain, showing how the mouseover event directly leads to a change detection cycle:
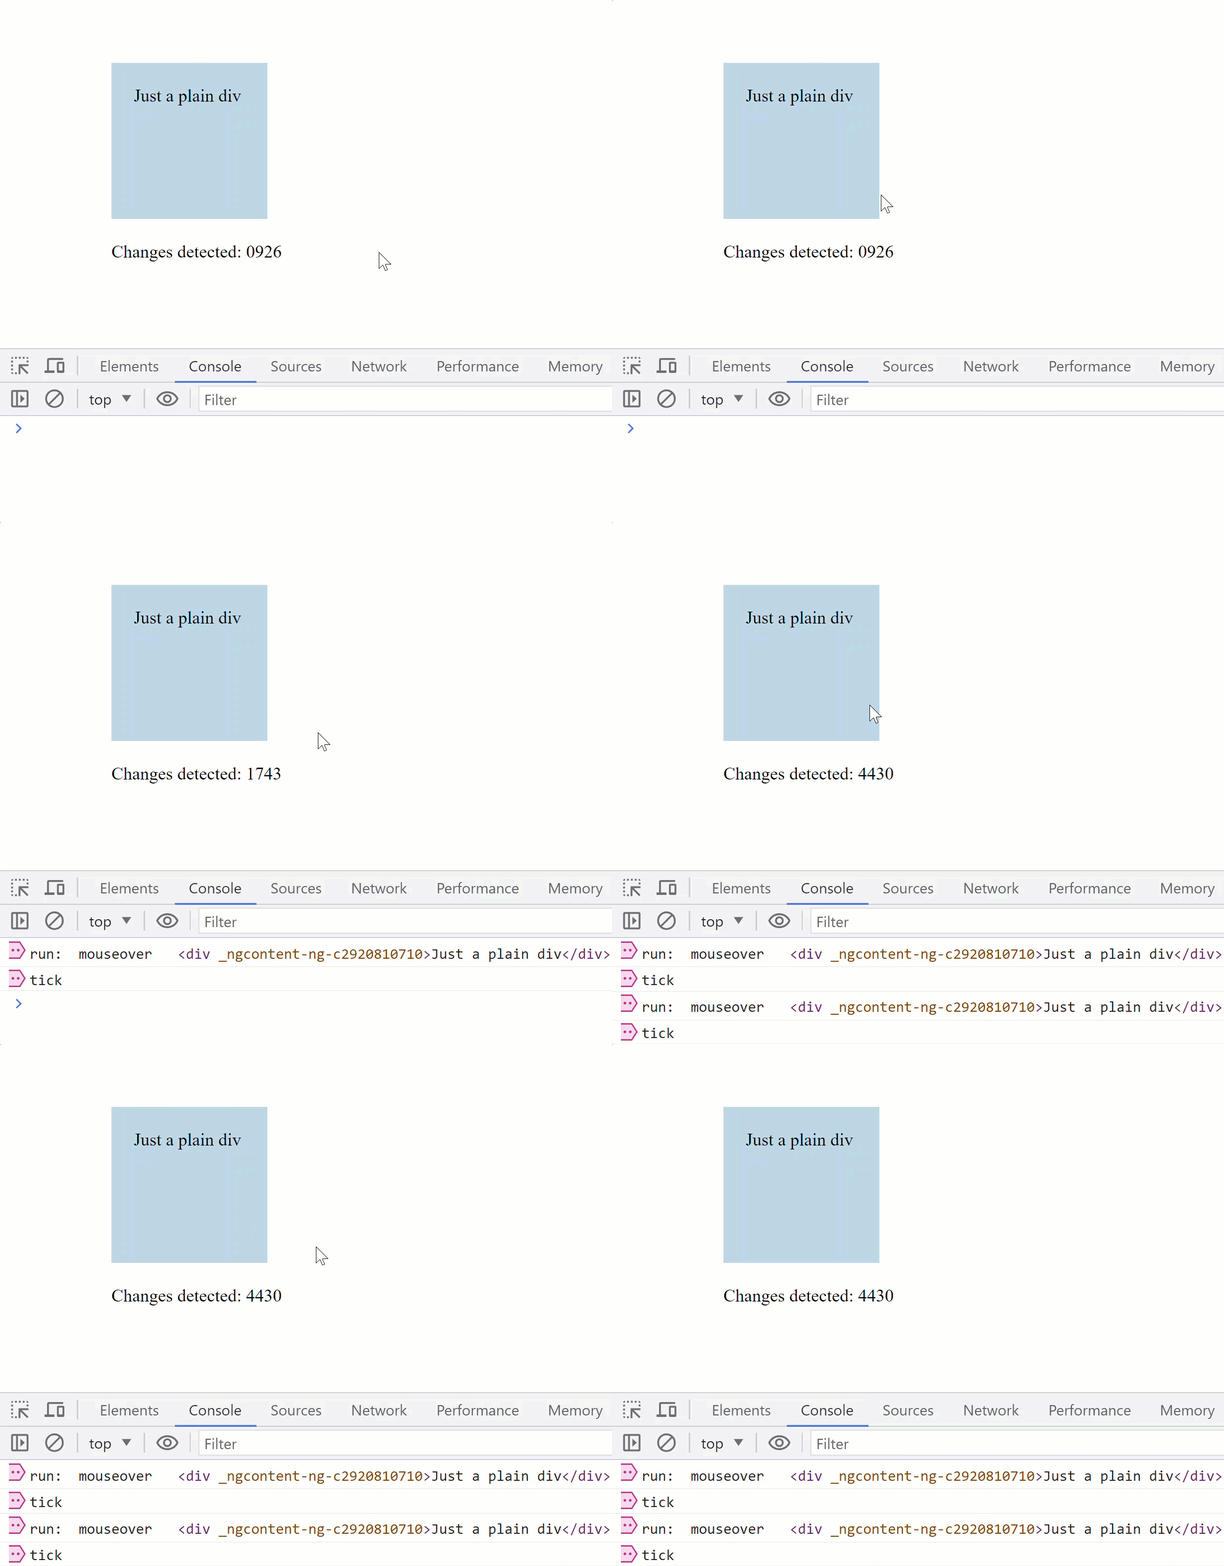
However, change detection isn't always caused by immediate events. Sometimes it's triggered by a macrotask that has a noticeable duration between its initiation and completion, such as a network request or a timer. To diagnose these cases, we must also track the task's scheduling phase.
Tracing the task source
Let's modify our UI slightly. We'll add a button that initiates a network request:
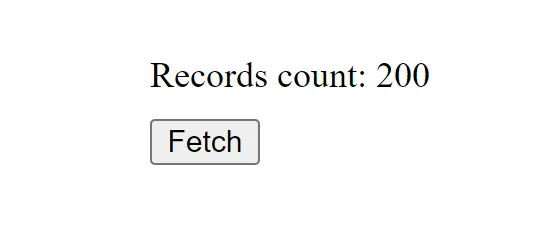
The corresponding implementation is:
@Component({
  selector: 'child-cmp',
 template: `
    <div>Records count: {{recordsCount}}</div>
    <button (click)="getTodos()">Fetch</button>
  `,
})
export class ChildComponent {
  getTodos() {
  fetch('https://jsonplaceholder.typicode.com/todos')
     .then(r => r.json())
     .then(c => this.recordsCount = c.length);
  }
}
In this setup, zone.js will manage two distinct tasks—the network call and several promises resolved via then. Our attention turns to the scheduling phase, which will lead us to the origin of the change detection run.
Task scheduling occurs inside the scheduleTask method. We'll add a logpoint there to output the source and type properties of the event:
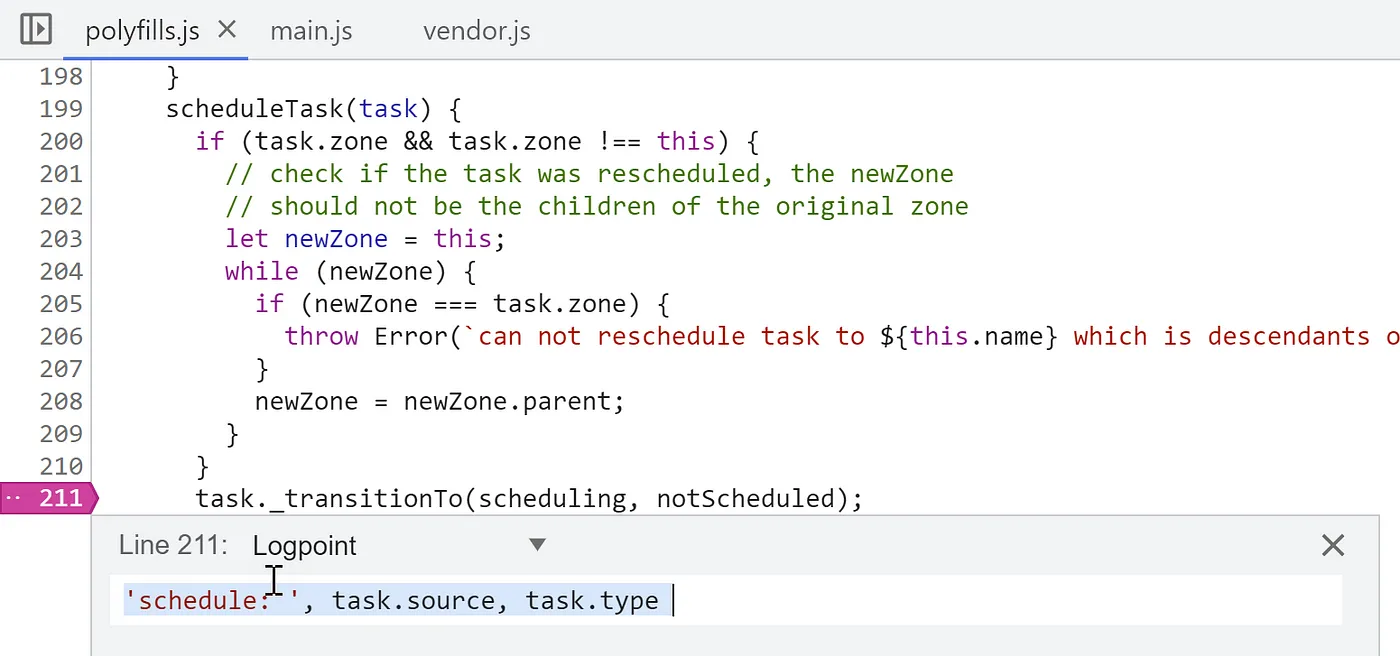
We'll also retain our logpoints in the tick and runTask methods:
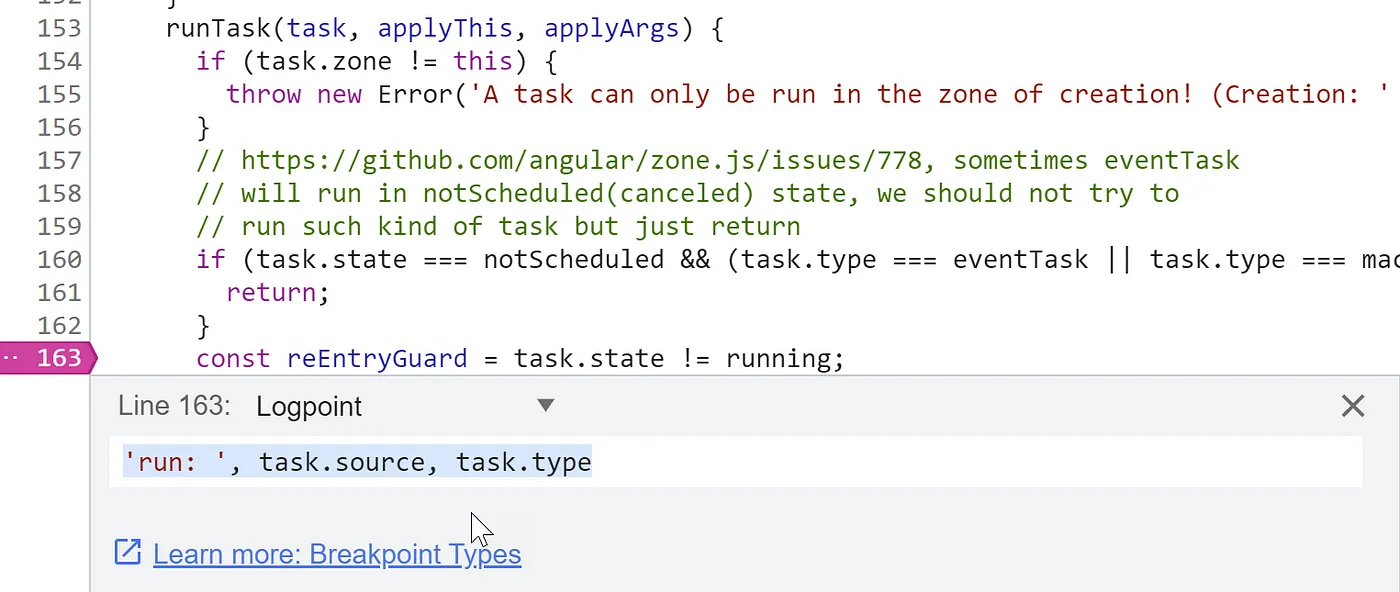
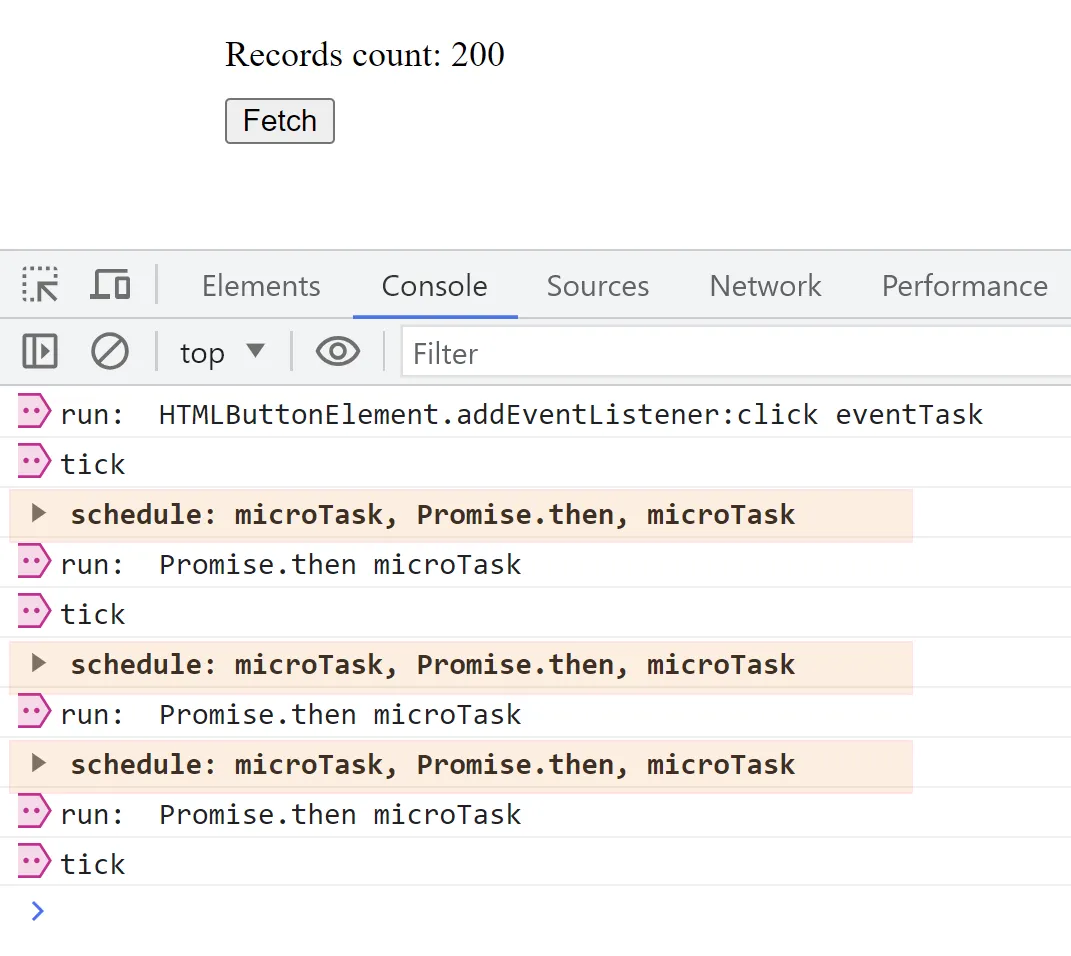
After clicking the button with these logpoints active, the console will display the following event sequence:
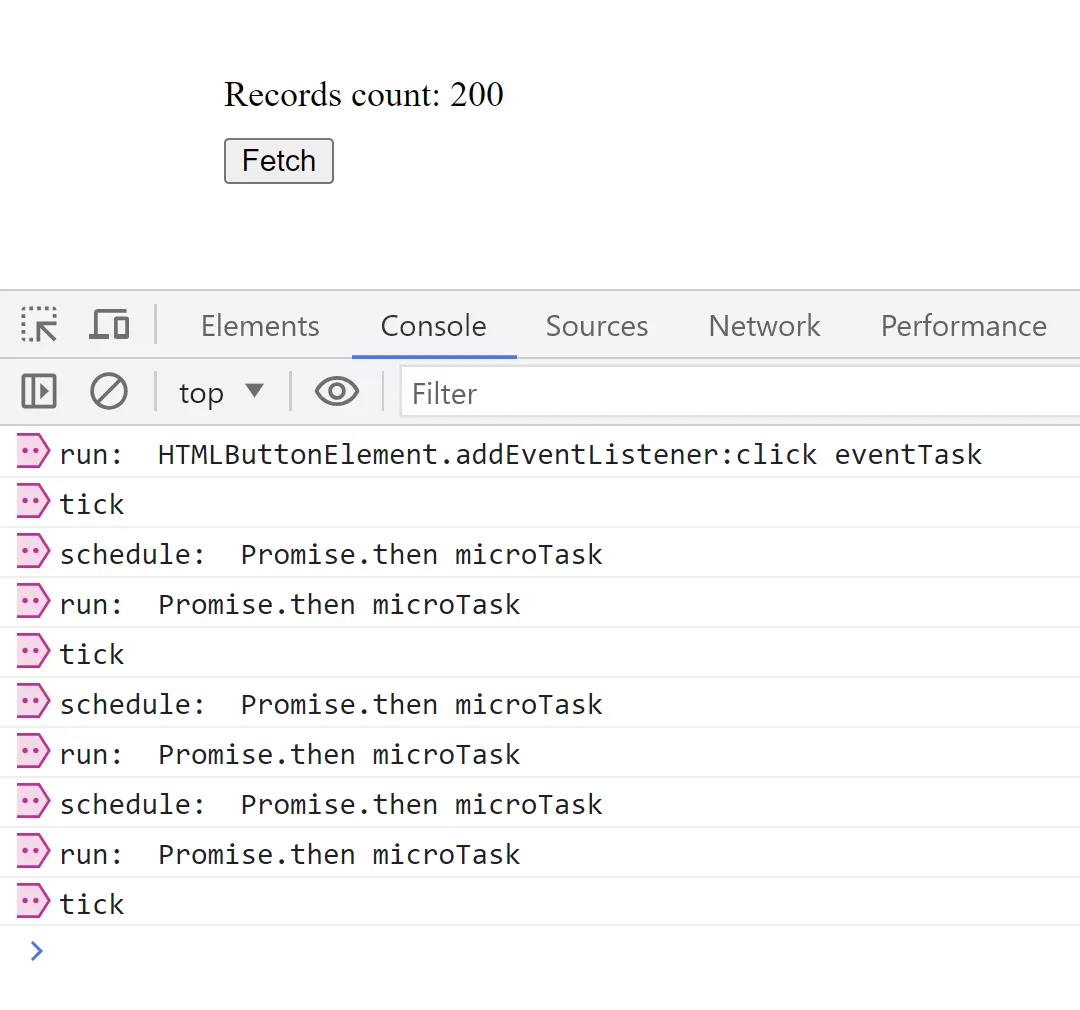
We can observe the click handler executing and a number of promises being scheduled. However, there's no macrotask scheduled for the fetch API call. This is because zone.js does not schedule a task for the network request itself; it simply calls the browser API right away. The native API call is then wrapped in a promise, resulting in our three promises—two from the application code and one that wraps the fetch macrotask for zone.js.
While seeing that promises are scheduled is helpful, it doesn't point to the specific root cause of the promise microtask. To determine that, we'll set a breakpoint in the scheduleMicroTask function and inspect the callstack:
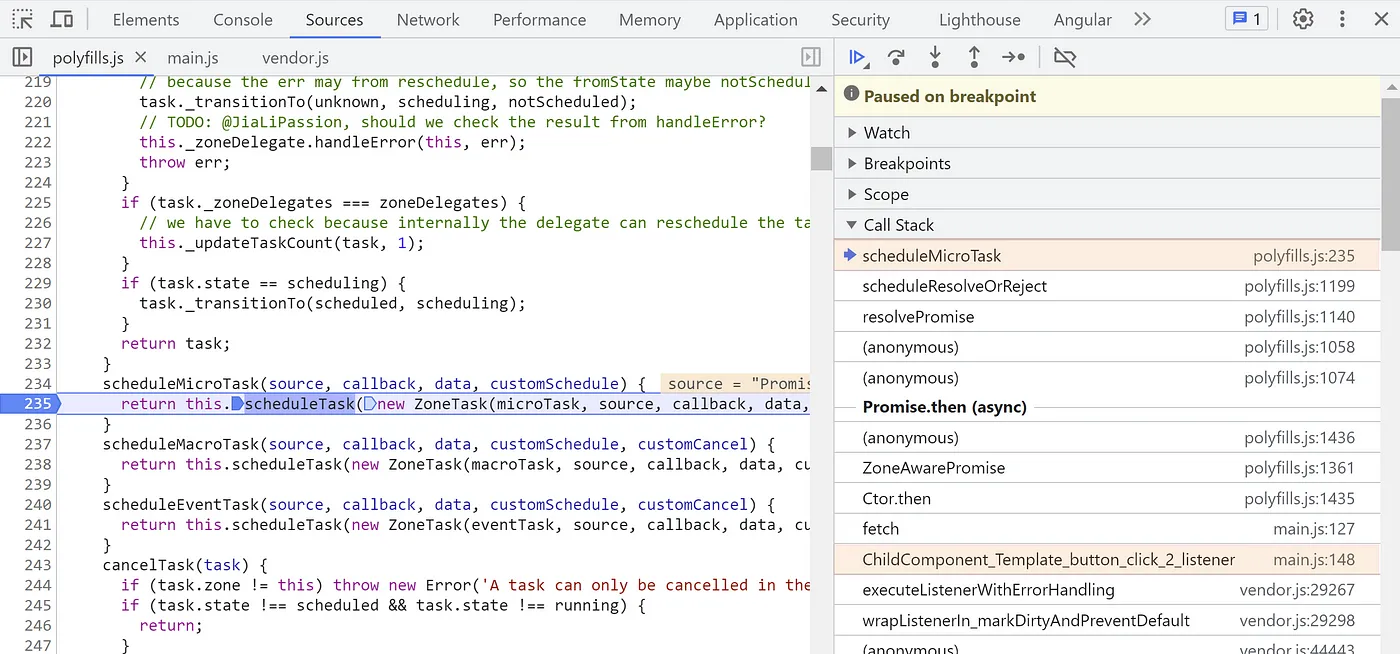
This view allows us to see that the promise originates from the click event handler.
Using console.trace
Another technique involves using the console.trace expression within our logpoints:
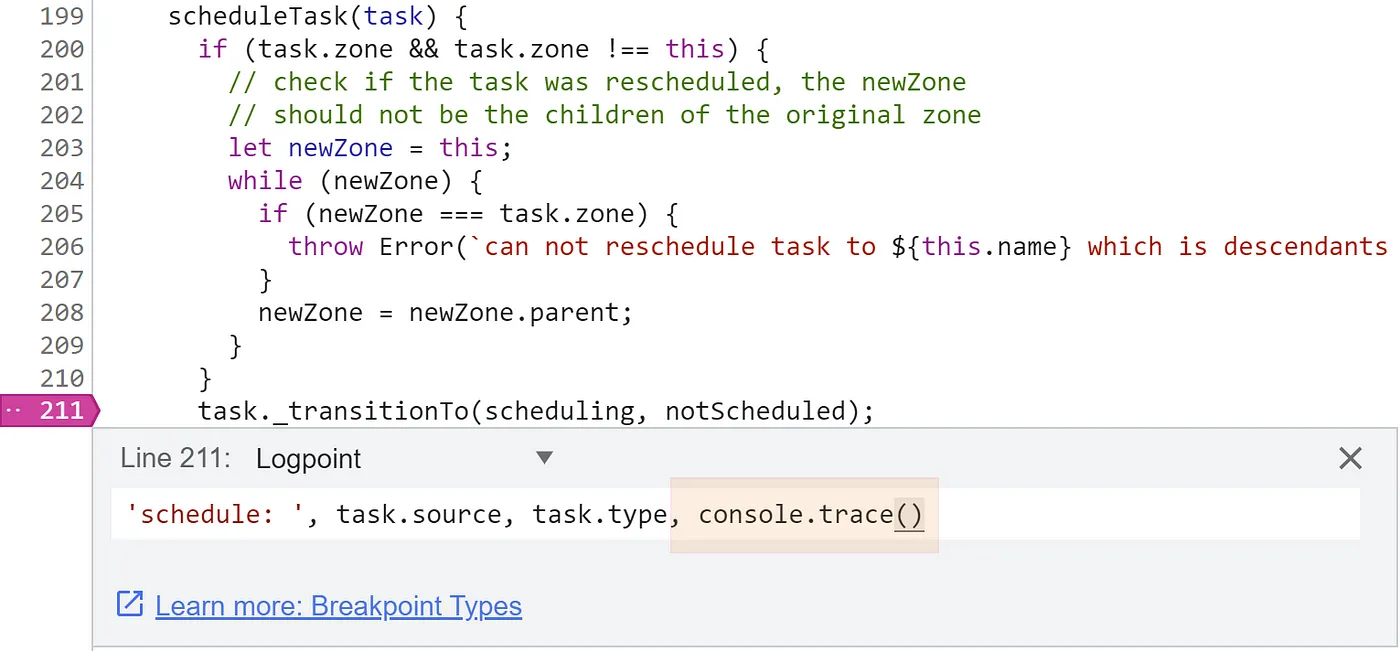
After clicking the button, the output looks like this:
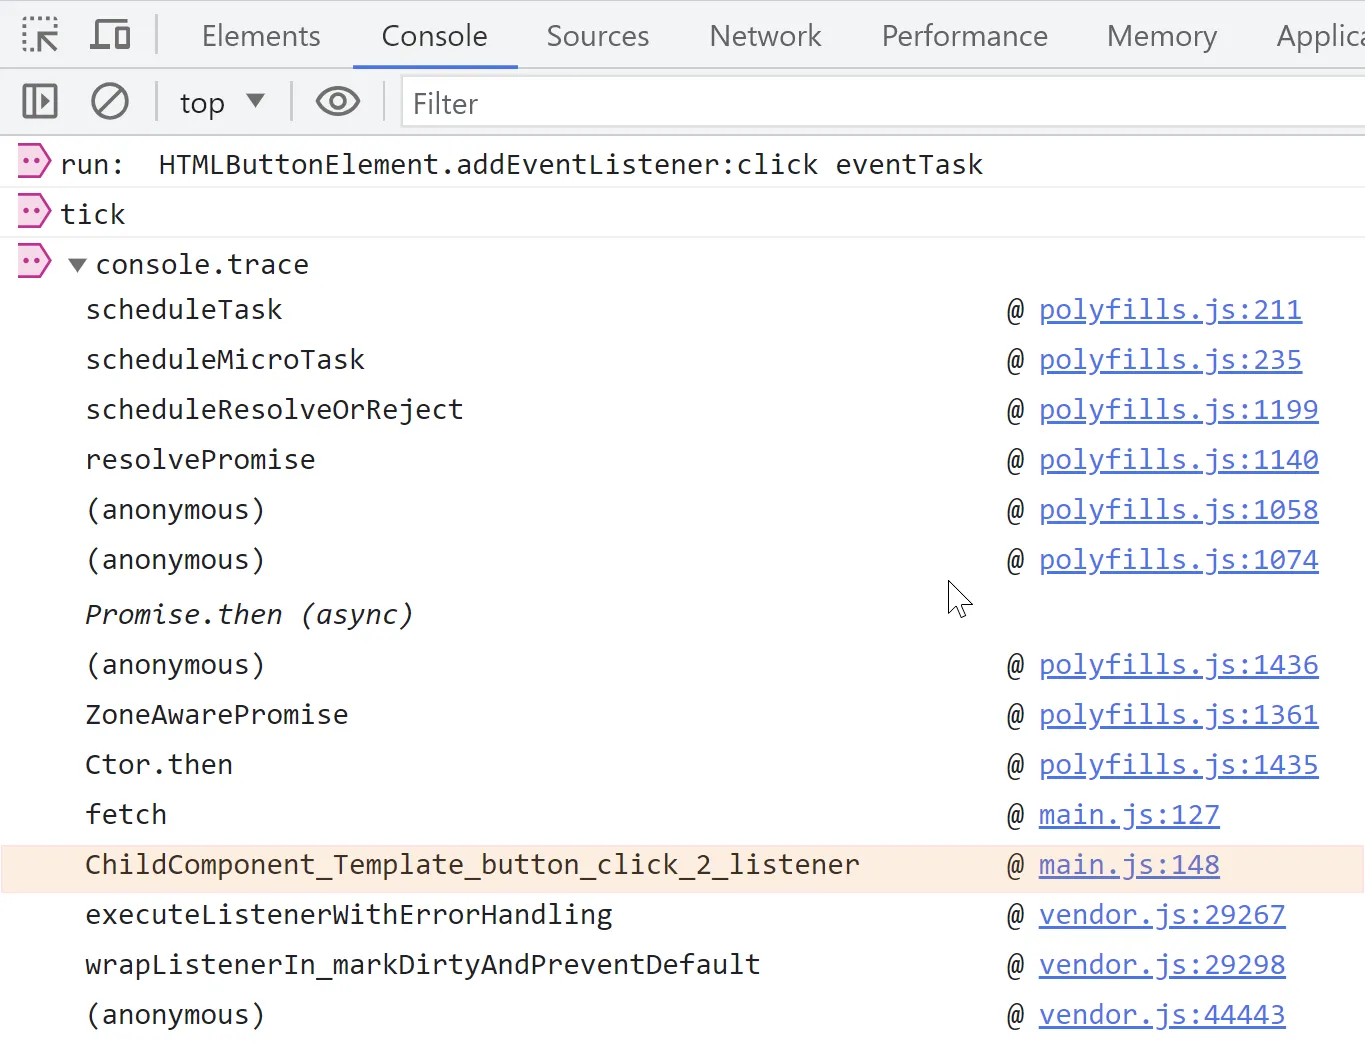
Once more, we can see that the promise was created in the click event handler.
But when there's a lot of console output, having traces expanded by default is inconvenient. To ensure they are collapsed upon logging, we can utilize the groupCollapsed API:
console.groupCollapsed(`schedule: ${task.type}, ${task.source}, ${task.type}`),
 console.trace(),
 console.groupEnd()
This code needs to execute when the script flow enters the scheduleTask function. Since logpoints can't handle this, we'll use a conditional breakpoint instead. Within the conditional breakpoint, we'll run statements to log the needed data. The key is that the last expression returns undefined, making the breakpoint condition evaluate to false, which stops the debugger from pausing execution.
The setup looks like this:
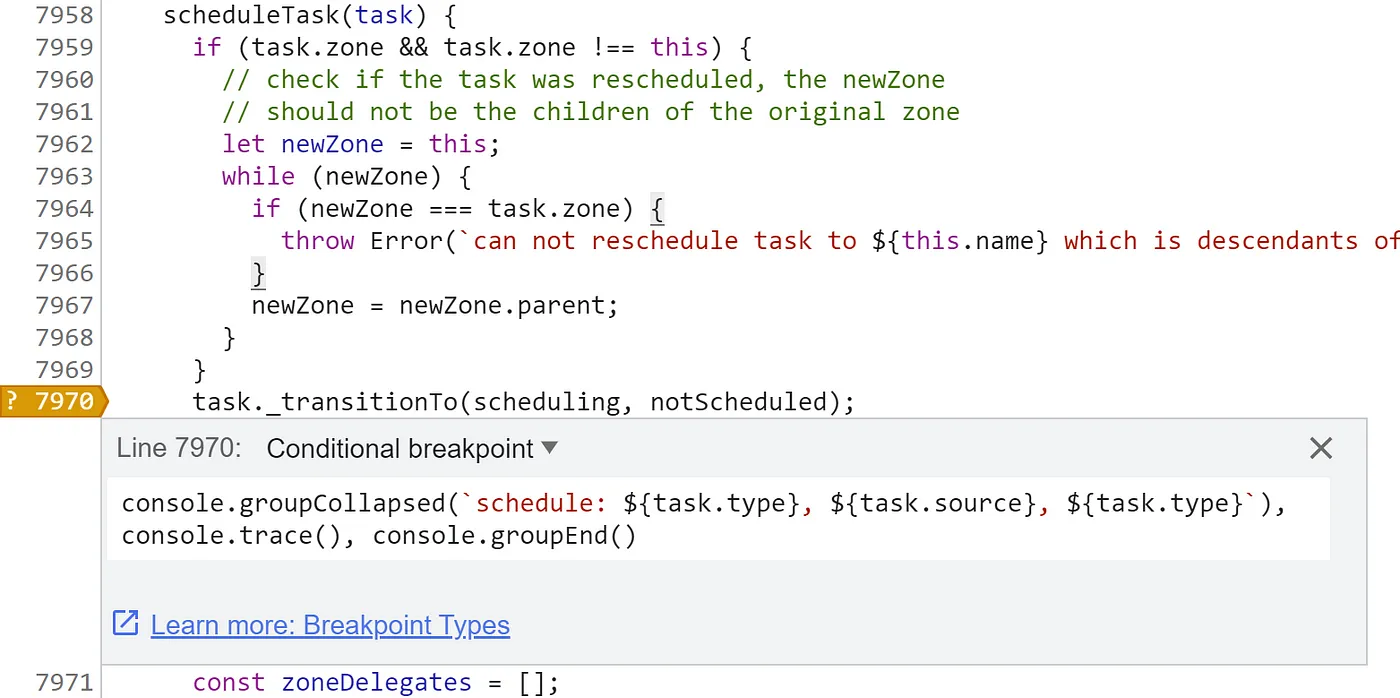
Upon running it, we see log groups whose labels begin with the word "schedule":
Expanding a group reveals the complete callstack:
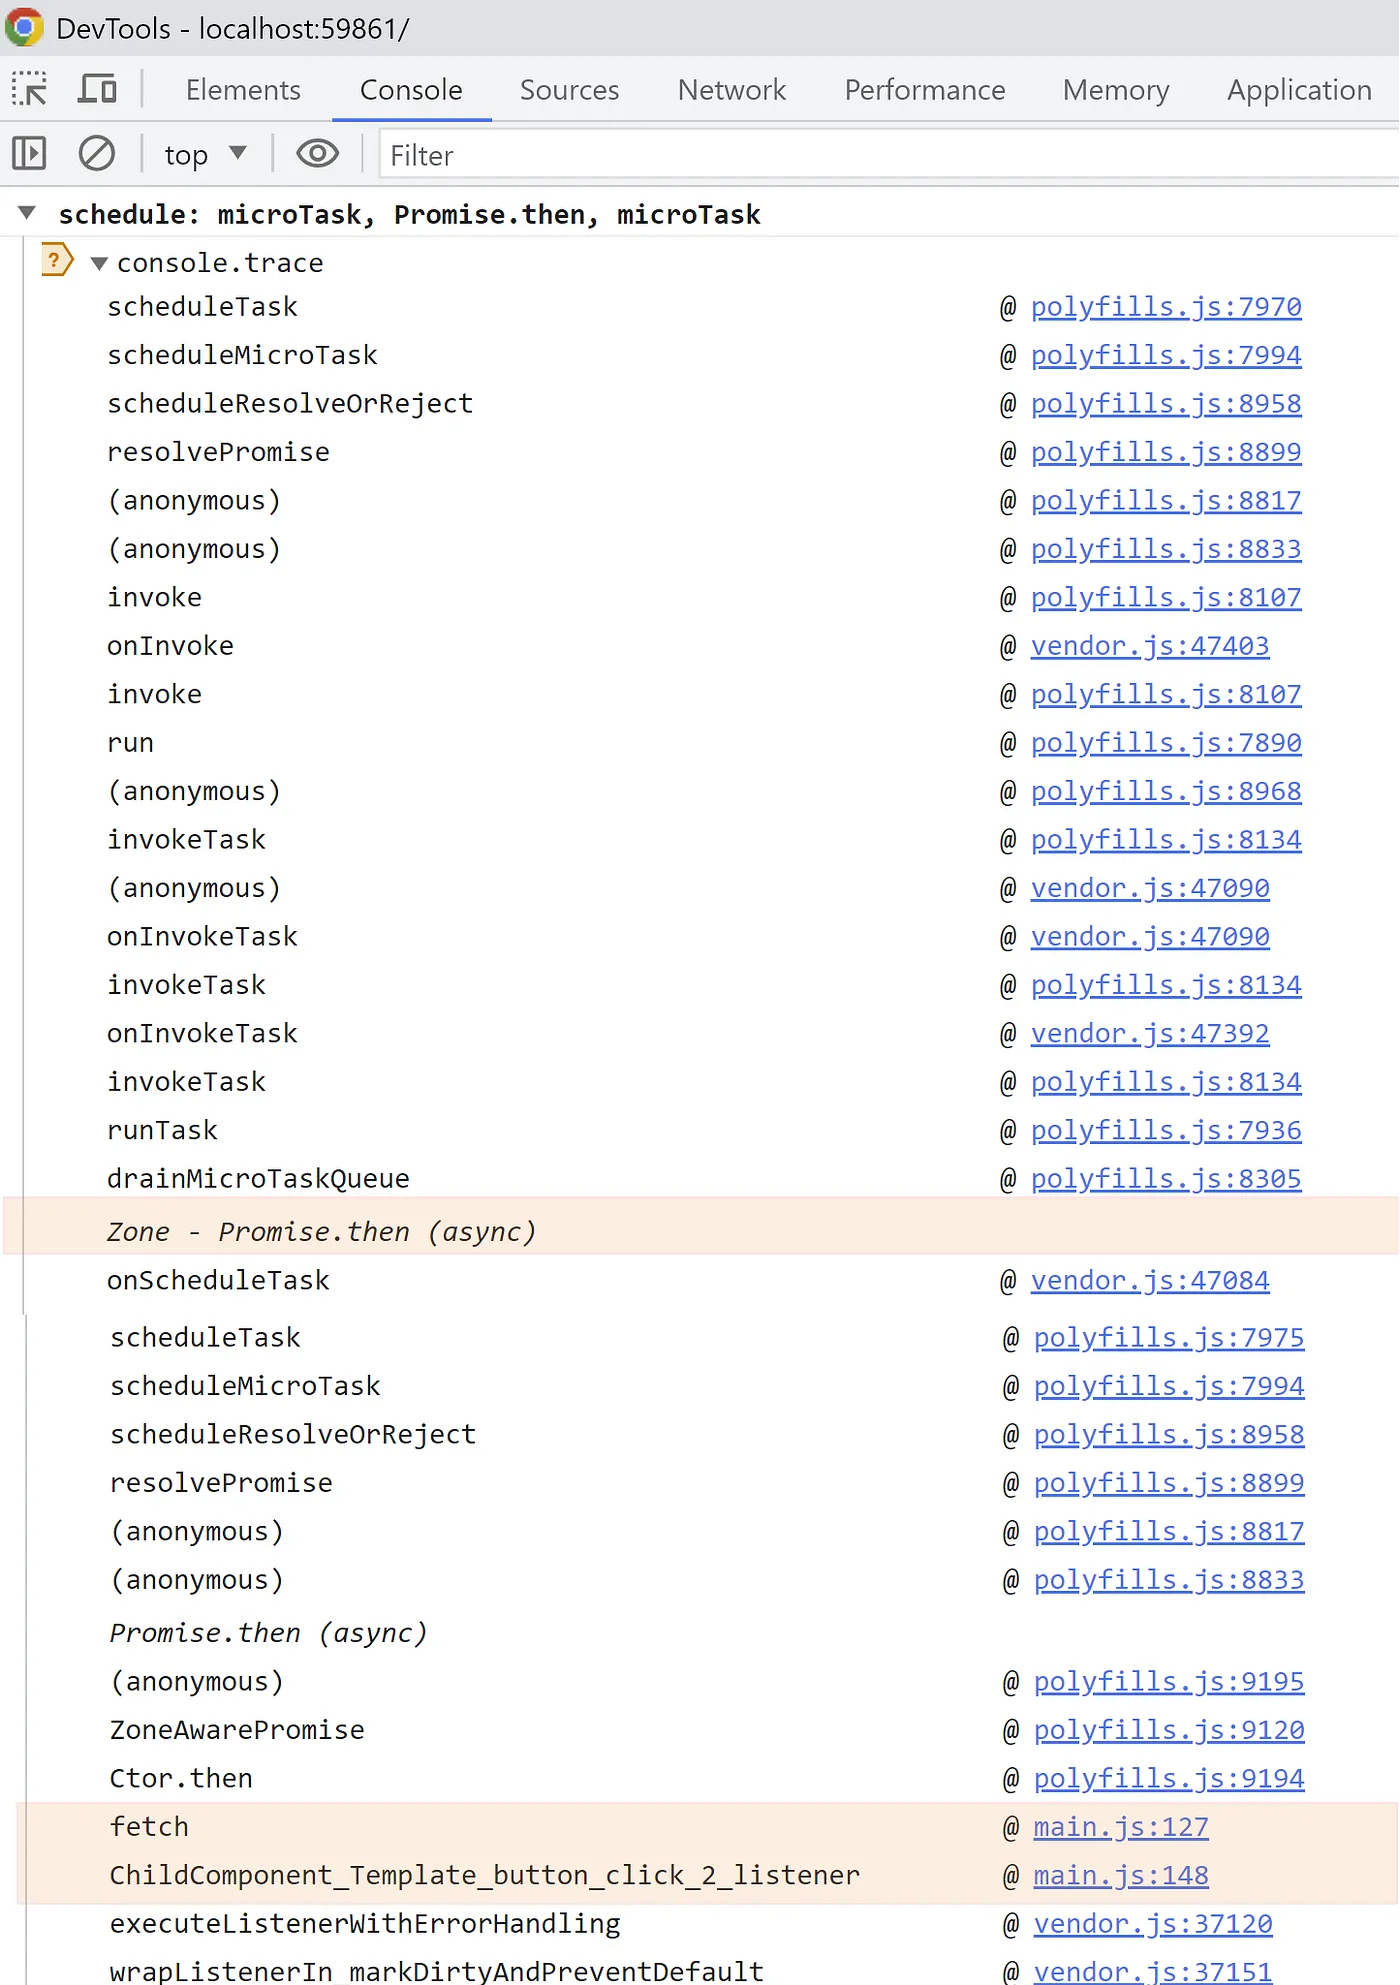
As we scroll through this callstack, it becomes apparent that the promise came from the click event handler.
Applying local overrides
Instead of relying on conditional breakpoints to run our expressions, we can use the local override API. With this, we can insert these expressions directly into the source code. Here's how:
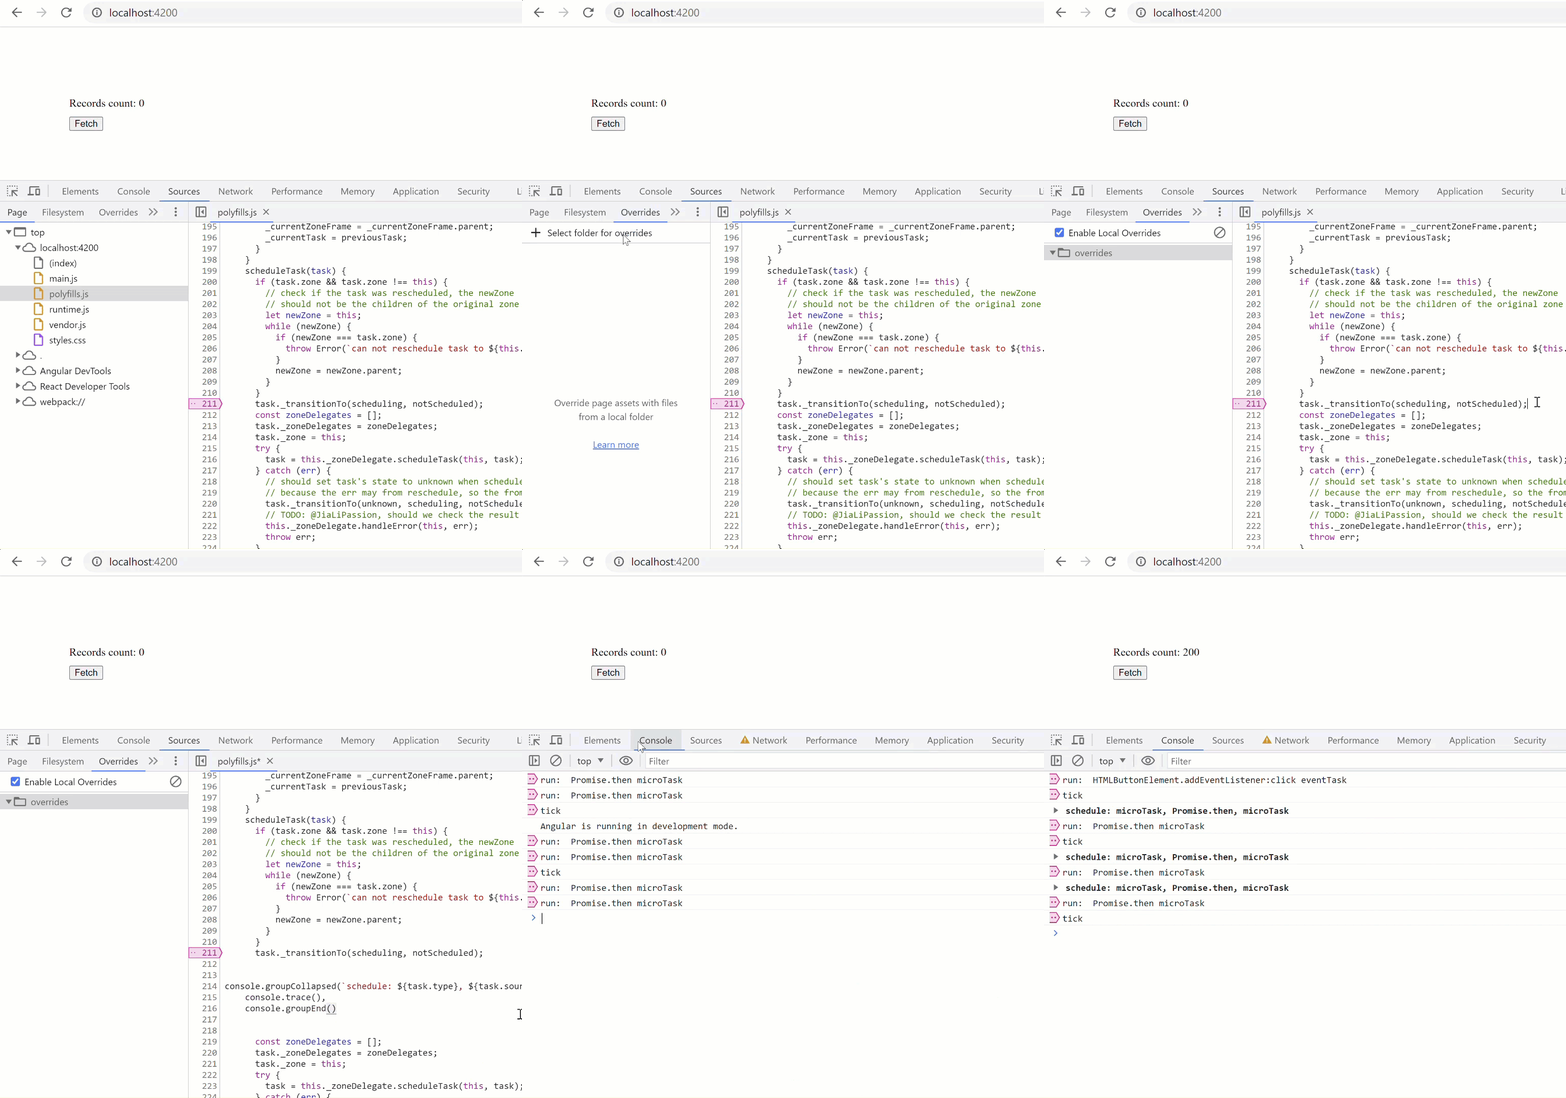
This source override feature proves to be exceptionally useful in many debugging contexts.
If you'd like to delve deeper into topics like this, check out the course: