Measuring change detection performance
When the change detection cycle becomes too slow, it can introduce noticeable jank in your application. Because change detection runs synchronously, a lengthy cycle leaves the browser with insufficient time to render frames, causing dropped frames and a degraded user experience. Minimizing the time spent computing changes is therefore critical. To help with this, Angular provides a built-in profiler, along with the option to supply a custom profiling implementation.
Determining whether slowness stems from the computation of changes or from applying those changes to the DOM can be tricky. The built-in profiler addresses this by running change detection repeatedly without any user interaction—no clicks, no typing. In a well-structured app, multiple consecutive change detection passes without user actions should remain fast and consistent.
Ideally, the profiler's reported time stays well below a single animation frame, which lasts about 16 milliseconds. For optimal results, it should be under 3 milliseconds, leaving enough room for the application logic, UI updates, and the browser's rendering pipeline to all fit within that 16-millisecond window (assuming a 60 FPS target).
To activate the built-in Angular profiler, we need to call the
enableDebugTools
function. It isn't exposed in the global scope by default, but that's not needed—since it only has to be invoked once,
we can do it as part of the application setup, such as in main.ts, much like enableProdMode.
The function expects a reference to an object from which an injector can be obtained, for example ModuleRef:
import { bootstrapApplication, enableDebugTools } from '@angular/platform-browser';

platformBrowserDynamic().bootstrapModule(AppModule)
  .then(moduleRef=> {
    enableDebugTools({injector: moduleRef.injector} as any);
  })
  .catch(err => console.error(err));
Once called, enableDebugTools attaches the profiler to the global ng namespace:
export function enableDebugTools<T>(ref: ComponentRef<T>): ComponentRef<T> {
  exportNgVar(PROFILER_GLOBAL_NAME, new AngularProfiler(ref));
  return ref;
}
With the profiler available in the console, we can invoke the profiler.timeChangeDetection function to measure change detection timings:
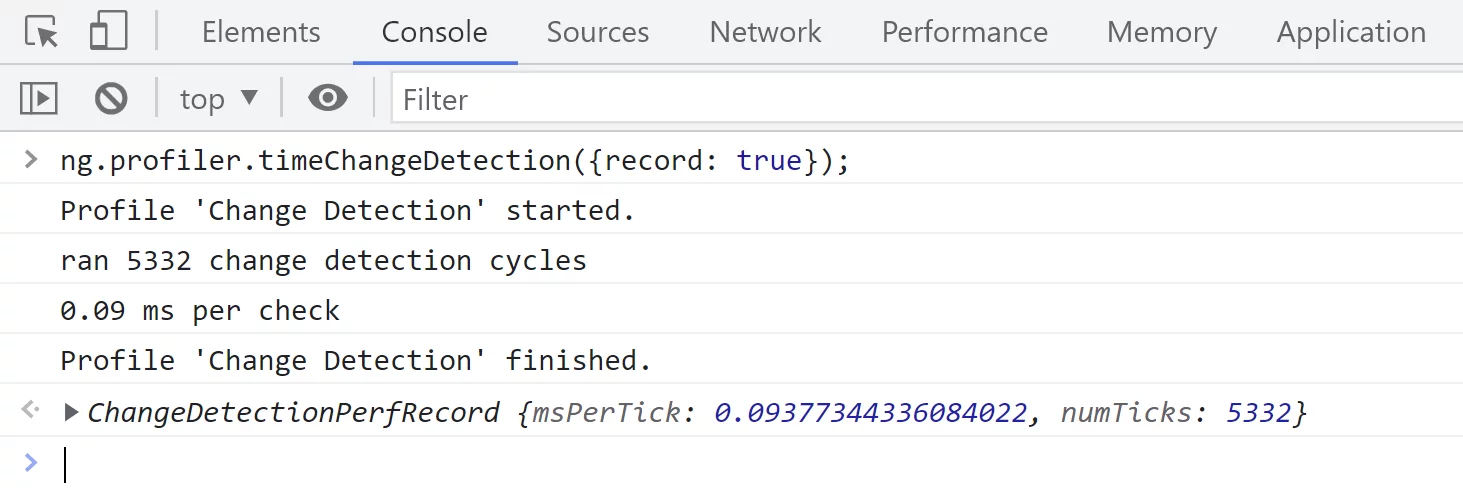
Here is
the core logic
behind the timeChangeDetection function:
timeChangeDetection(config: any): ChangeDetectionPerfRecord {
    const start = performanceNow();
    let numTicks = 0;

    while (numTicks < 5 || (performanceNow() - start) < 500) {
      this.appRef.tick();
      numTicks++;
    }

    const end = performanceNow();
    const msPerTick = (end - start) / numTicks;

    window.console.log(`ran ${numTicks} change detection cycles`);
    window.console.log(`${msPerTick.toFixed(2)} ms per check`);
}
It repeatedly executes the tick method—the global change detection—running as many cycles as possible within 500 milliseconds.
If those cycles collectively exceed that time limit, it caps the run at 5 cycles.
It then calculates the average duration of a single change detection cycle in milliseconds and logs it to the console.
The measured values vary based on the current UI state. As you profile different screens, you'll notice the numbers differ from page to page. For strategies to cut down change detection overhead, take a look at the Optimization section.
The profiler also supports creating a CPU profile if you pass the parameter object {record: true}:
ng.profiler.timeChangeDetection({ record: true });
However, the API
used within timeChangeDetection to record the profile is not standardized.
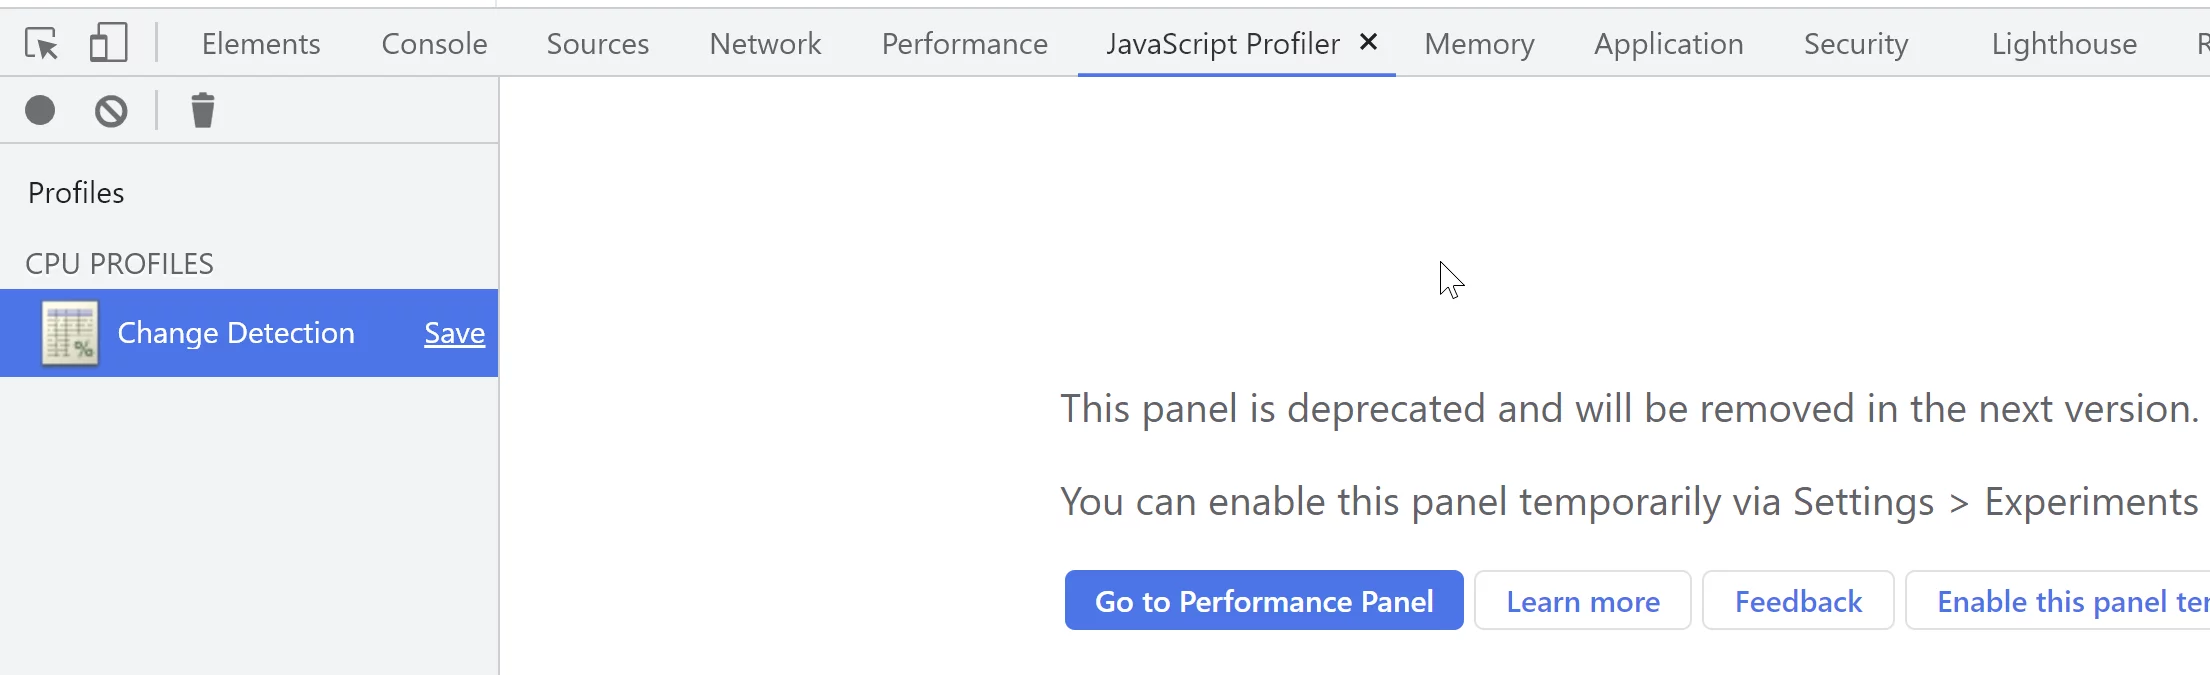
Furthermore, the Profiler page in Chrome, where such recordings would be displayed, is itself deprecated:
We can craft our own profiling function using the modern User Timing API to record timestamps (marks) and durations (measures). Let's walk through how to do that.
Local change detection with a custom function
First, we need to build a custom version of the timeChangeDetection function. Here's a possible implementation:
import { ChangeDetectorRef } from '@angular/core';

function customTimeChangeDetection(hostElement) {
  performance.mark('Start');

  const start = performance.now();
  let numTicks = 0;

  const injector = (window as any).ng.getInjector(hostElement);
  const viewRef = injector.get(ChangeDetectorRef)

  while (numTicks < 5 || (performance.now() - start) < 500) {
    viewRef.detectChanges();
    numTicks++;
  }

  performance.mark('End');

  const entry = performance.measure('Change Detection', 'Start', 'End');
  const msPerTick = entry.duration / numTicks;

  window.console.log(`ran ${numTicks} change detection cycles`);
  window.console.log(`${msPerTick.toFixed(2)} ms per check`);
}
The function takes a host element for a component,
uses its injector to obtain the corresponding ChangeDetectionRef:
const injector = (window as any).ng.getInjector(hostElement);
const viewRef = injector.get(ChangeDetectorRef)
This approach enables local profiling of change detection for any child component.
Note that we also leverage performance.mark and performance.measure to compute the average time.
Since we're accessing the global ng namespace, which is only present in development mode,
make sure enableProdMode() is not active when running this function.
Next, we need to make our custom function available globally:
platformBrowserDynamic()
  .bootstrapModule(AppModule, {ngZoneEventCoalescing: true})
  .then((ref) => {
    (window as any).customTimeChangeDetection = customTimeChangeDetection;
  })
  .catch((err) => {...});
and then execute it like this:
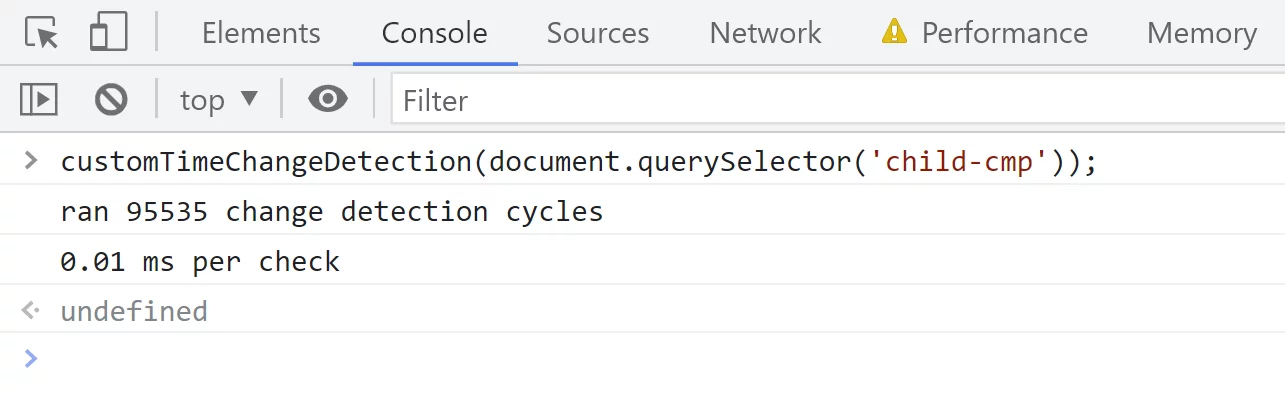
customTimeChangeDetection(document.querySelector('kw-header'));
Before profiling, it's wise to enable CPU throttling to approximate a real-world machine, rather than a high-performance development setup:

Once the profiler is run, here's what we see:
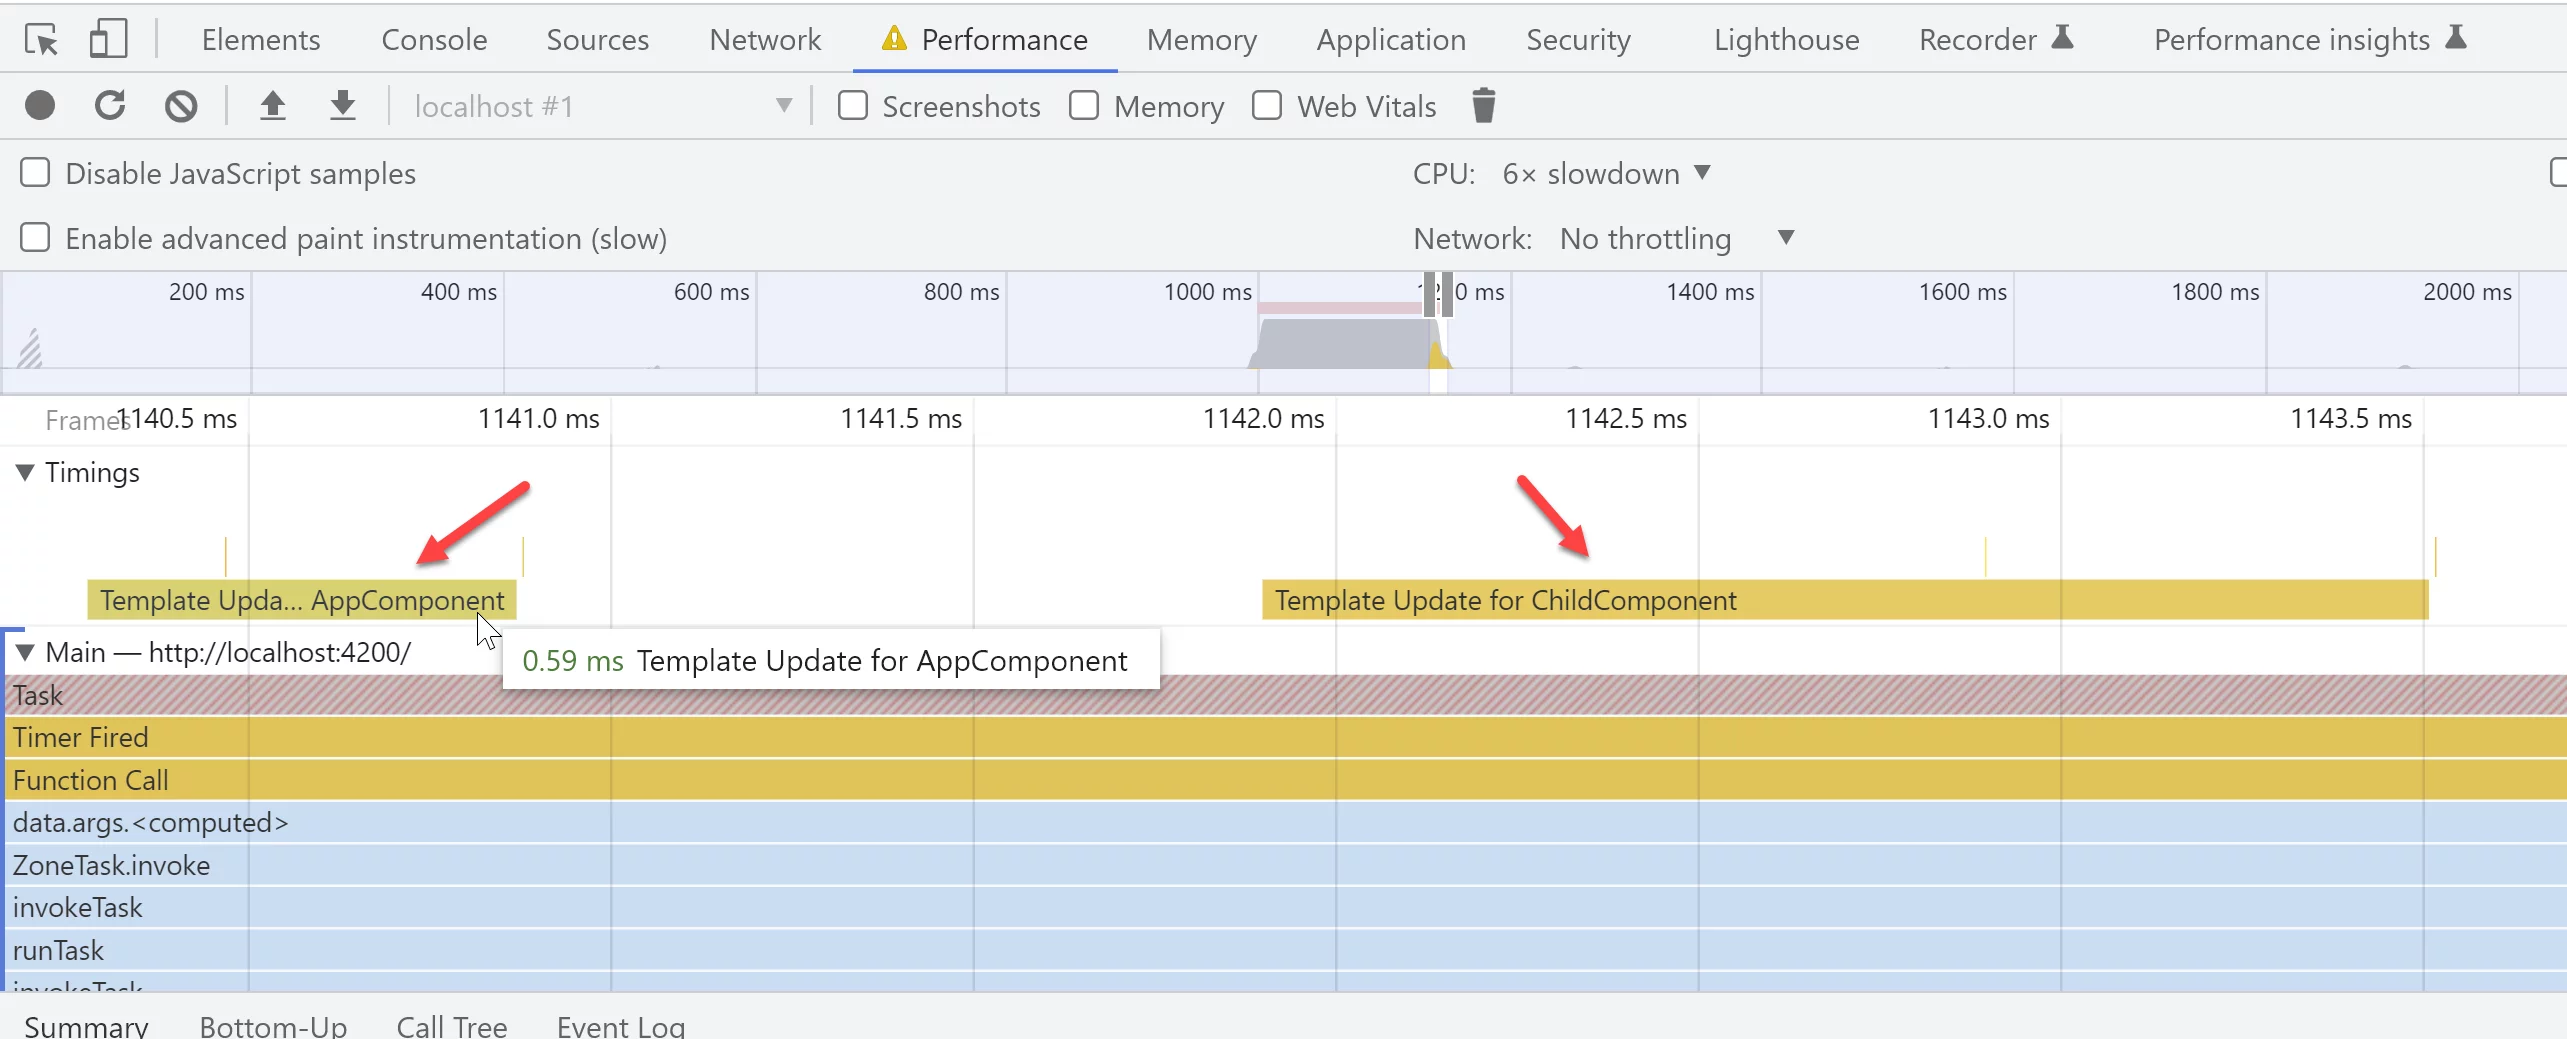
If recording is enabled while the profiler is active, you'll find entries under the Timings section:
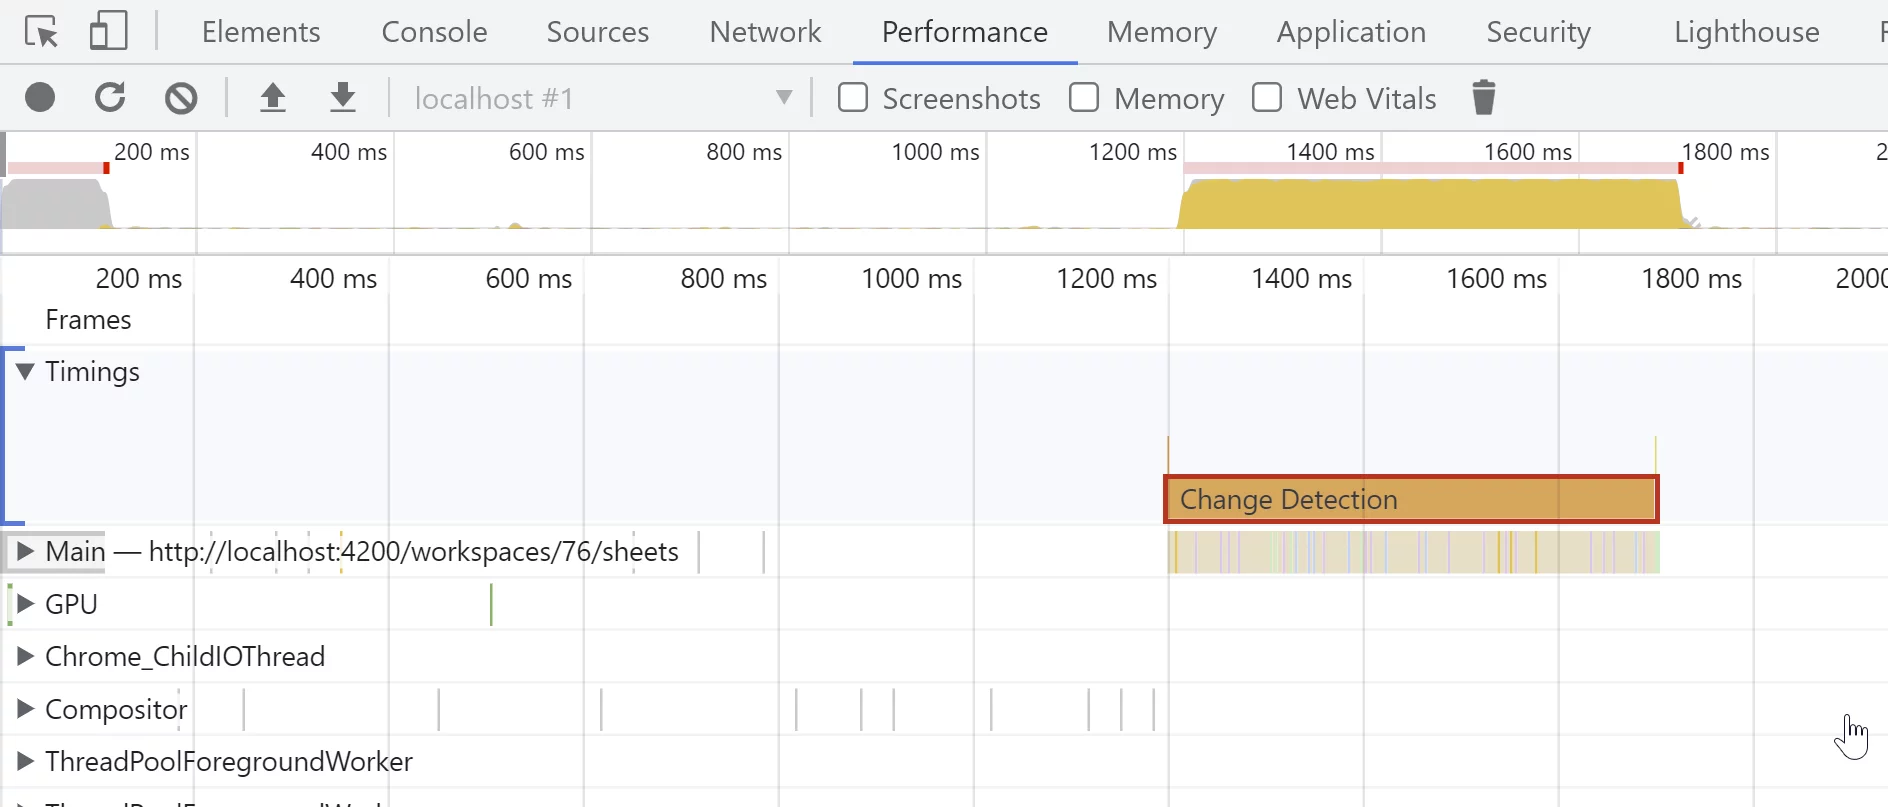
But as shown, it covers the entire span of multiple change detection cycles, not just a single one. That limits how useful this record is when presenting it in the performance tab.
Let's look at how we can push profiling further by implementing a granular profiler to pinpoint time spent in specific parts of the change detection process.
Custom granular profiler
Angular exposes the
setProfiler
function on the global ng namespace. It accepts a callback that gets invoked before and after
specific runtime actions—for instance, around template update function execution.
To support this, Angular instruments internal framework code to call the provided function at
various checkpoints during the change detection lifecycle.
The standard event set is defined on the ProfilerEvent enum. Here's the full list of events:
const profilerEvent = [
  'TemplateCreateStart',
  'TemplateCreateEnd',
  'TemplateUpdateStart',
  'TemplateUpdateEnd',
  'LifecycleHookStart',
  'LifecycleHookEnd',
  'OutputStart',
  'OutputEnd',
];
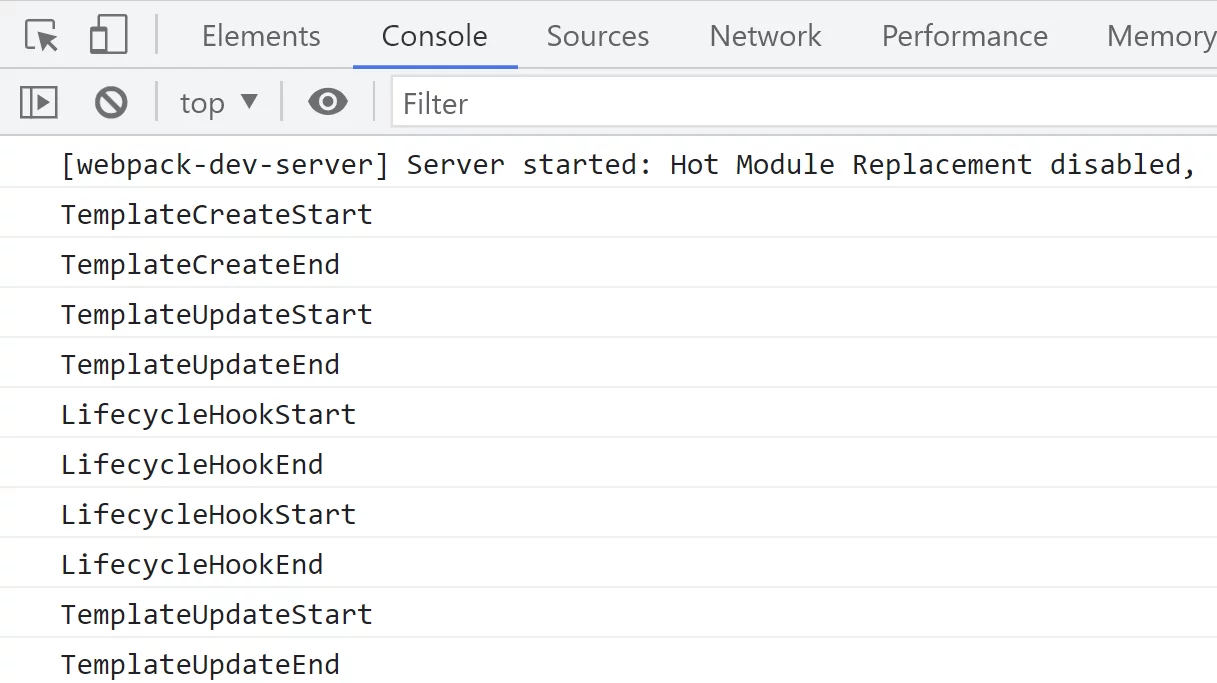
If we register a custom callback and then trigger change detection:
const profilerEvent = [...];

(window as any).ng.ɵsetProfiler((event, instance, hookOrListener) => {
  console.log(profilerEvent[event]);
});

ng.applyChanges(ng.getComponent(document.querySelector('child-cmp')));
Here's an example of how the framework inserts profiler calls into the
executeTemplate
function, emitting two events—TemplateUpdateStart and TemplateUpdateEnd:
function executeTemplate<T>(tView, lView, templateFn, rf, context) {
  const consumer = getReactiveLViewConsumer(lView, REACTIVE_TEMPLATE_CONSUMER);
  const prevSelectedIndex = getSelectedIndex();
  const isUpdatePhase = rf & RenderFlags.Update;
  try {
    ...
    const preHookType =  isUpdatePhase
				? ProfilerEvent.TemplateUpdateStart
				: ProfilerEvent.TemplateCreateStart;

    profiler(preHookType, context as unknown as {});
    consumer.runInContext(templateFn, rf, context);
  } finally {
    ...
    const postHookType =
        isUpdatePhase ? ProfilerEvent.TemplateUpdateEnd : ProfilerEvent.TemplateCreateEnd;
    profiler(postHookType, context as unknown as {});
  }
}
We can then see all these events listed in the console:
Suppose we're interested in measuring how long it takes Angular to render the template.
That means we need to capture the time between TemplateUpdateStart and TemplateUpdateEnd.
We can assemble a function like this:
const profilerEvent = [...];

function timeTemplateUpdate(event, instance, hookOrListener) {
  if (!instance?.constructor) return;

  const instanceName = instance.constructor.name;
  const evtName = profilerEvent[event];

  switch (evtName) {
    case 'TemplateUpdateStart': {
      performance.mark(`${instanceName}:TemplateUpdateStart`);
      break;
    }
    case 'TemplateUpdateEnd': {
      performance.mark(`${instanceName}:TemplateUpdateEnd`);
      const entry = performance.measure(`Template Update for ${instanceName}`,
        `${instanceName}:TemplateUpdateStart`,
        `${instanceName}:TemplateUpdateEnd`
      );
      console.log(entry.name, entry.duration)
      break;
    }
  }
});
Once we register it
ng.ɵsetProfiler(timeTemplateUpdate);
and run it in the console, we'll get outputs like the following:
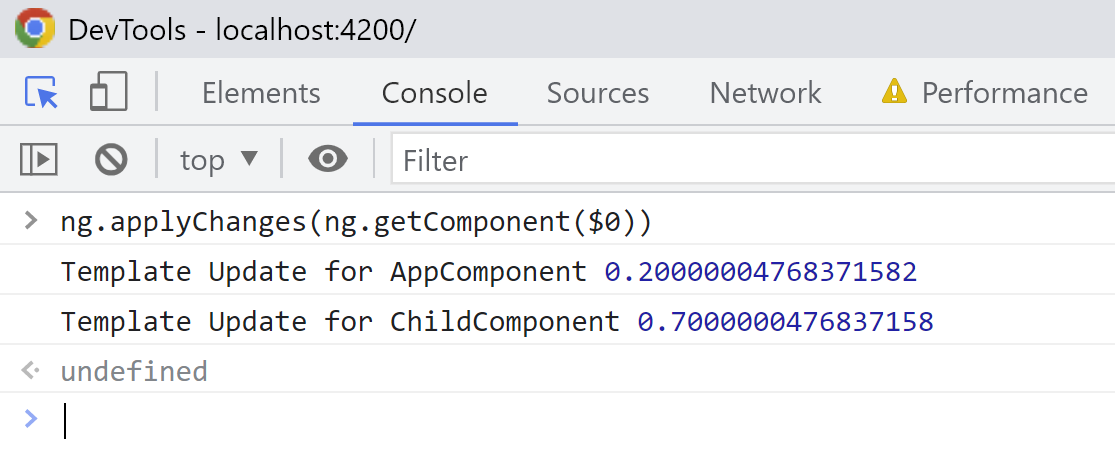
And because we used the User Timing API, with recording active, the segments will also appear under the user timings section: