
This article should be helpful for both front-end and back-end engineers. If Gatsby.js isn't your focus, feel free to jump straight to the "Patching jest-workers to debug child process in Node" section.
In recent weeks, I've devoted a significant amount of time to unravel the inner workings of the Gatsby build process. It's a fascinating system with many clever patterns, such as leveraging a Redux store on the server to coordinate information across various parts of the build. I plan to publish a series of articles diving deeper into these techniques soon.
A particular stumbling block for me during this exploration was Gatsby's use of Node's child process functionality, which it employs to parallelize the rendering of static pages. In traditional languages like Java or C++, parallelization relies on threads, but JavaScript lacks this feature. Node.js achieves concurrent execution by spawning multiple child processes instead. For more on this distinction, you can check out this resource.
Node provides two primary modules for creating child processes: the established child_process and the more recent worker_threads. The latter mimics traditional threading by allowing shared memory between the parent and its spawned children.
Internally, Gatsby relies on the jest-workers package to parallelize its build steps. This becomes clear when you inspect the implementation of the WorkerPool:
const Worker = require(`jest-worker`).default
const { cpuCoreCount } = require(`gatsby-core-utils`)

const create = () =>
  new Worker(require.resolve(`./child`), {
    numWorkers: cpuCoreCount(),
    forkOptions: {
      silent: false,
    },
  })

module.exports = {
  create,
}
By default, this package uses Node's child_process module, but it can be configured to use worker_threads by setting enableWorkerThreads: true when the worker is created.
Uncovering the path to debugging a child process in Gatsby.js
Over the years of examining the source code of various frameworks, I've picked up numerous skills for debugging and reverse-engineering. I've previously compiled some of these strategies in a piece titled Level Up Your Reverse Engineering Skills, published on inDepth.dev.
To get started with debugging Gatsby, I created a fresh project by running the Gatsby CLI command gatsby new gatsby-site. To launch the app with Node's debug inspector enabled, I use a command like this:
$ node --inspect-brk node_modules/gatsby/dist/bin/gatsby.js build
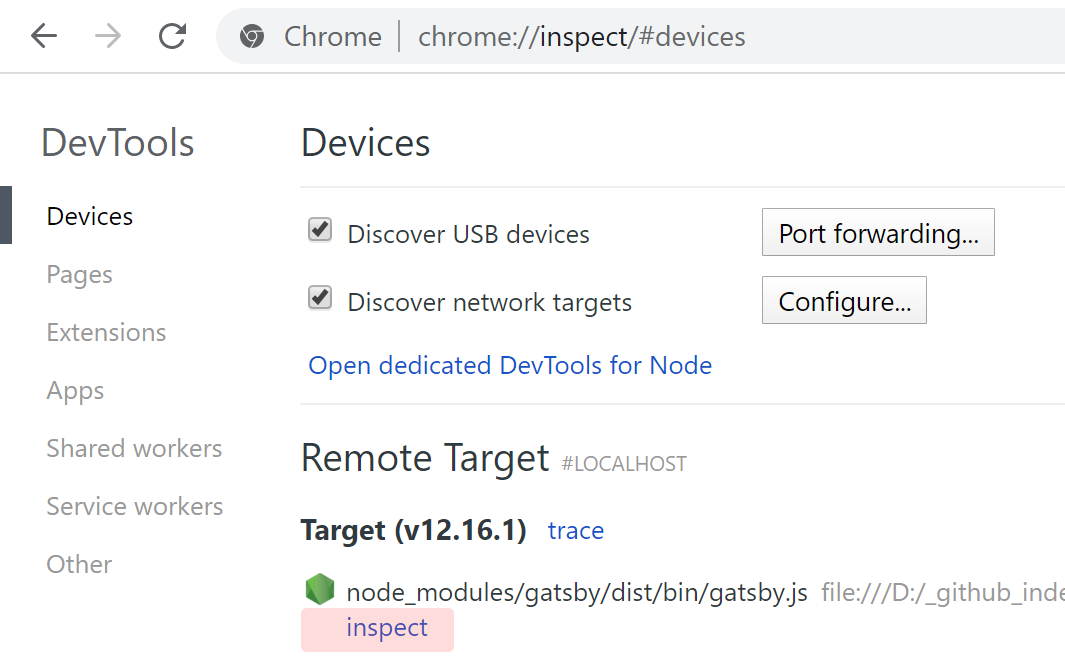
Next, I locate the process under chrome://inspect and select the inspect link.
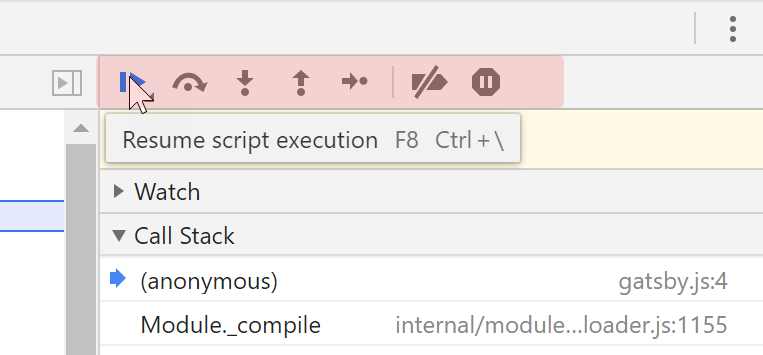
Once the DevTools window opens, with the debugger stopped at the very first line, I use the standard playback controls to let the execution proceed.
A challenge I hadn't faced before was debugging the spawned child processes. As noted earlier, Gatsby uses this method to perform the HTML rendering portion of the build.
During my investigation, I placed a debugger statement inside a Header component like so:
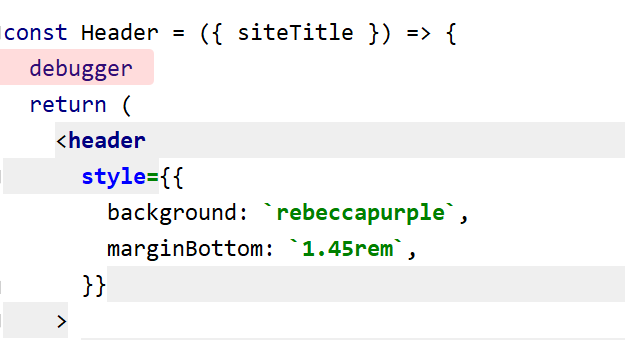
After starting the process in debug mode and connecting via Chrome DevTools, I hit “Resume” (F8), expecting the debugger to stop at my breakpoint. To my surprise, the execution continued without stopping, and the build completed successfully. Since this wasn't the first time a breakpoint hadn't fired, I initially assumed that this specific code path wasn't being executed.
A significant amount of time passed before it hit me that the code within the Header component was executing in a separate child process, which the Chrome debugger wasn't connected to.
This posed a major obstacle. Without the ability to set breakpoints in the script, understanding the details becomes near impossible. A quick search surfaced several reports indicating that Chrome doesn't automatically attach to child processes.
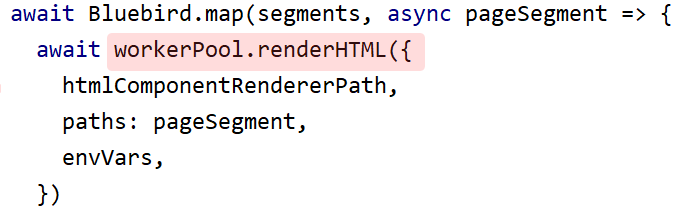
My initial workaround was to manually copy the entire render-html.js file, containing the [renderHTML](https://github.com/gatsbyjs/gatsby/blob/49fd769f695ccfa6e990e3eaae7c886f073db19b/packages/gatsby/src/utils/worker/render-html.js#L16) function that Gatsby executes in a forked child process:
I then attempted to run it directly under the node debugger, supplying the necessary configuration. However, this proved quite cumbersome and inefficient, as I kept having to determine which environment variables were needed to prevent errors.
Around this time, I published an article about debugging Webpack builds, where I described a method for locating the specific JavaScript file in node_modules to use with a node debugger. In the comments, someone suggested using ndb as an alternative, which would remove the need to figure out the exact file path. For instance, instead of writing:
$ node --inspect-brk node_modules/webpack/bin/webpack.js
one could simply execute:
$ ndb webpack
I began to investigate this tool and came across an intriguing option:
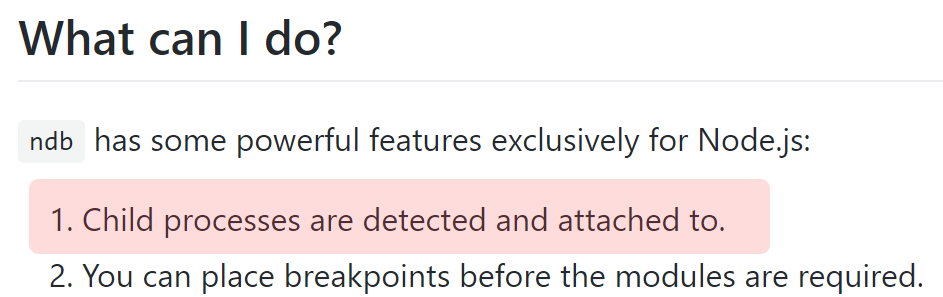
This was precisely the capability I required. I proceeded to launch Gatsby with the debugger, like so:
$ ndb gatsby build
When ndb started, it presented a debugging interface that resembled Chrome DevTools but with a dark theme.
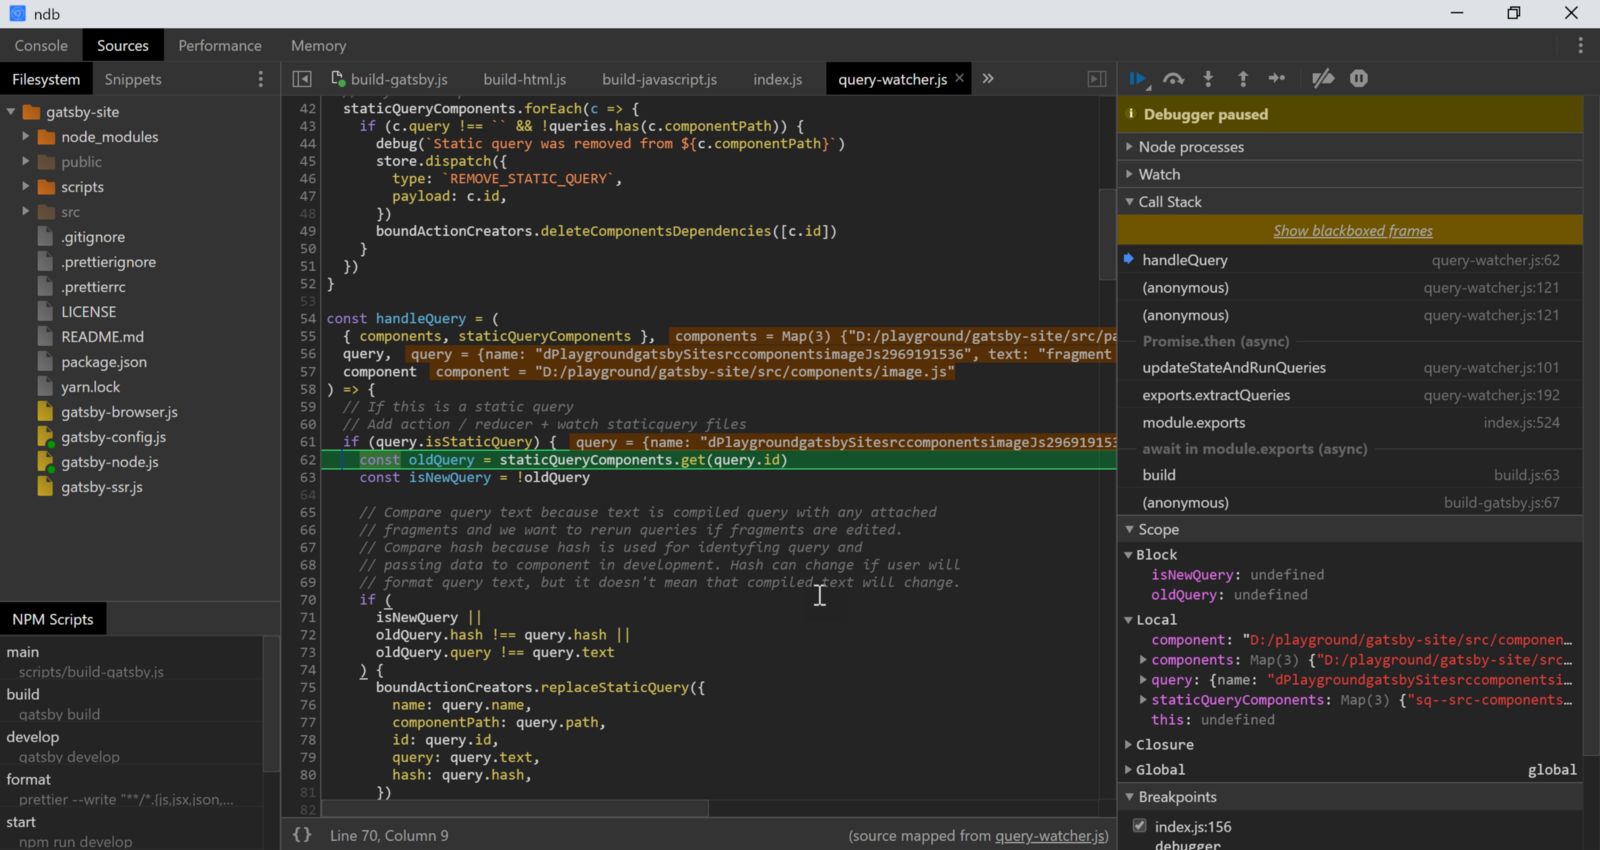
This time, the debugger successfully halted at my breakpoint within the component.
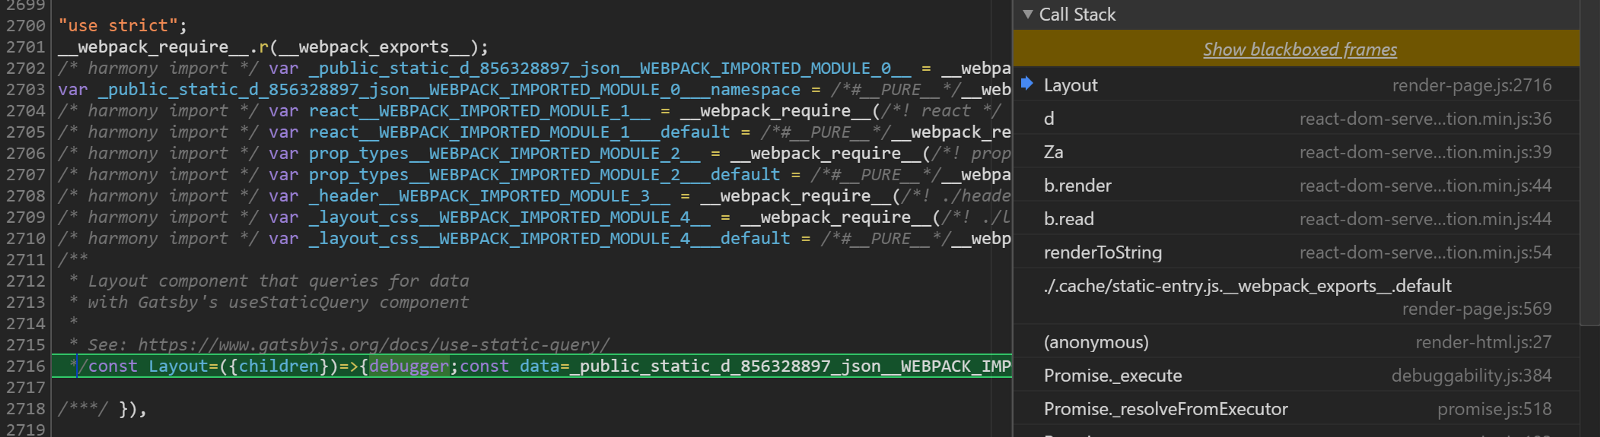
It even displayed a list of all the spawned processes, a feature I found very helpful.

Still, ndb can be somewhat unstable, and running into a problem like the one below is not unusual:

Even with its quirks, it proved to be a valuable tool. But my search for a more robust solution continued.
Modifying jest-workers to enable child process debugging in Node
While chatting about my challenges with Victor, he floated an idea: patch the code that spawns the child process to include the inspect-brk option when forking.
Before diving into Gatsby, I wanted to test this theory within a simple application that just uses jest-workers. In my experience, it's always better to isolate each technology to understand its individual behavior, which later helps in diagnosing how they interact and identifying the source of a problem.
I checked the jest-worker documentation and started with its first example. My only change was converting the ECMAScript module syntax to CommonJS:
const Worker = require('jest-worker').default;

async function main() {
    const worker = new Worker(require.resolve('./worker'), {numWorkers: 1});
    const result = await worker.hello('Alice'); // "Hello, Alice"
    console.log(result);
}

main();
parent.js
and
exports.hello = function hello(param) {
    debugger;
    return 'Hello, ' + param;
};
worker.js
I added a debugger statement within the hello function in worker.js and launched the script under the debugger. As anticipated, the breakpoint was never hit.
$ node --inspect-brk index.js
The breakpoint was missed because the function was running in a child process, and my debugger wasn't attached to it
Now, I had to figure out the exact approach for patching the code. Since the parent process is launched with the --inspect-brk flag, it seemed logical that the same flag should be passed to every child process it spawns.
Setting --inspect-brk causes the inspector agent to bind to the default host 127.0.0.1 and listen on port 9229. Because only one debugger can use a port at a time, each child process would need its own unique port. That's precisely the solution I implemented.
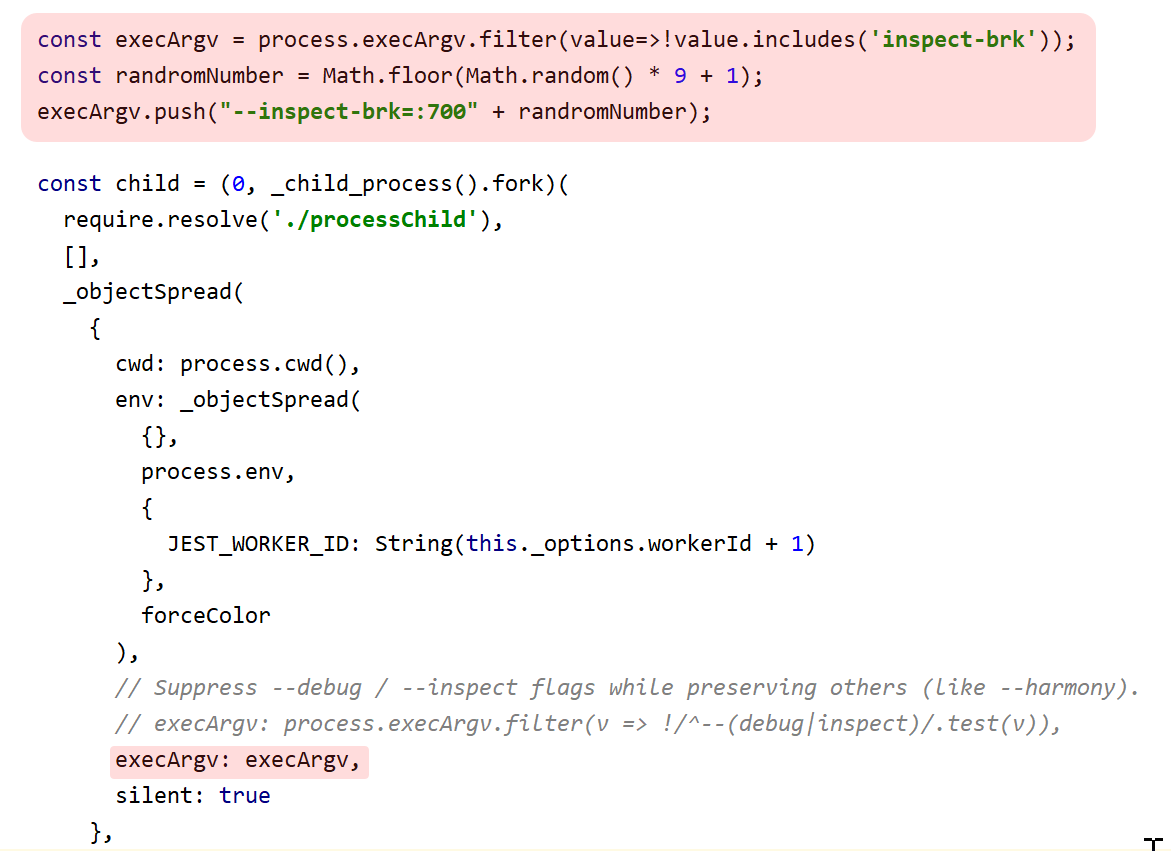
I opened node_modules\jest-worker\build\workers\ChildProcessWorker.js and inserted the logic below:
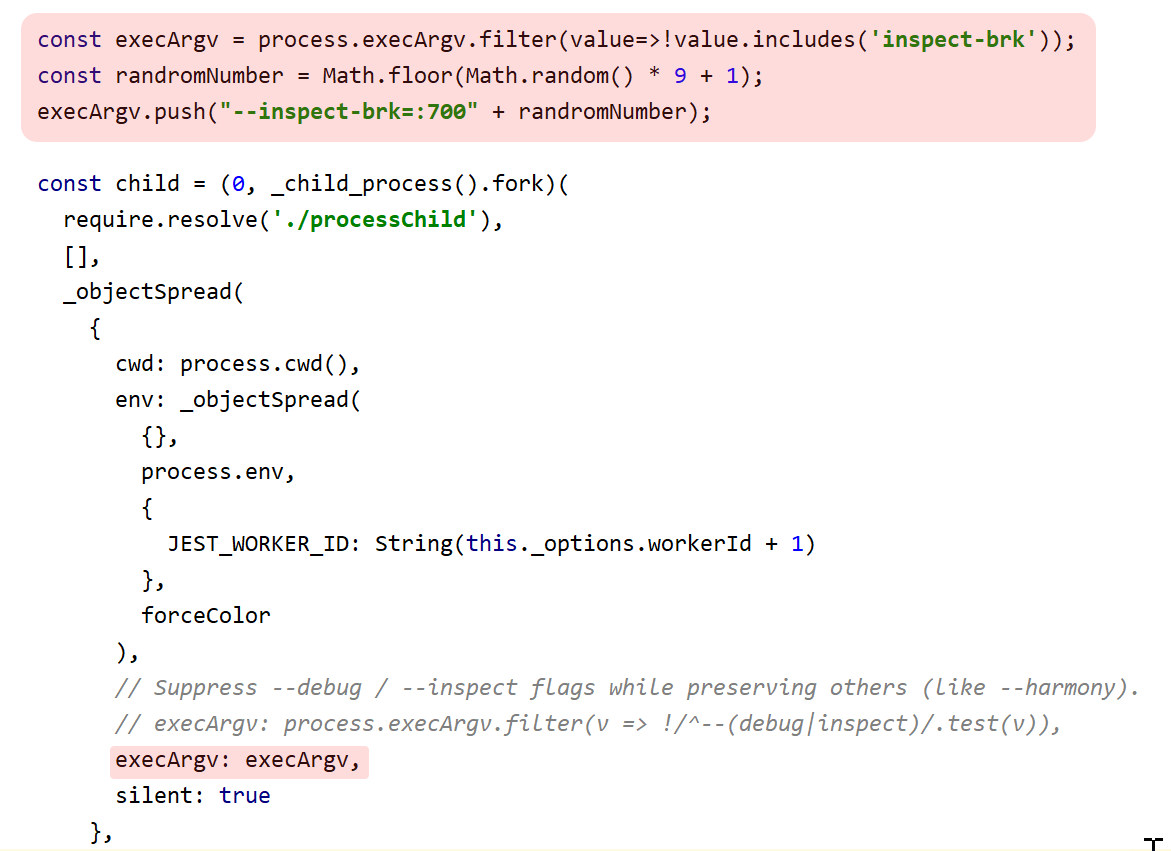
If you'd like to try this yourself, here's a gist with the code:
const execArgv = process.execArgv.filter(value=>!value.includes('inspect-brk'));
const randromNumber = Math.floor(Math.random() * 9 + 1);
execArgv.push("--inspect-brk=:700" + randromNumber);
Make sure to actually pass the updated execArgv array to the fork method, as illustrated in the screenshot.
Notice that in the original implementation, jest strips out any inspect or debug flags:
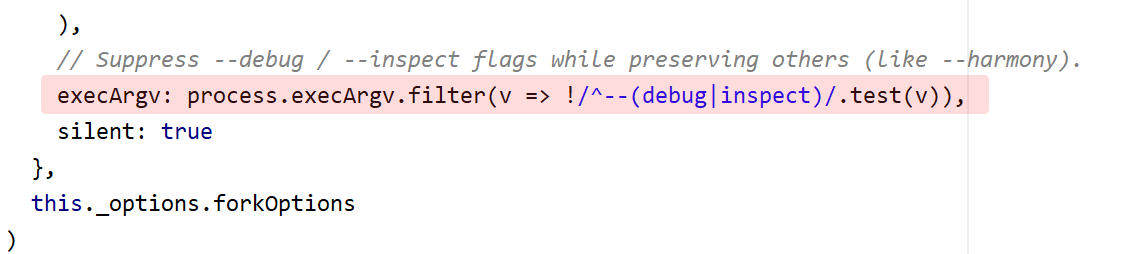
My modification simply appends the inspect-brk option and a port number with a random ending digit to the child process arguments via [argV](https://nodejs.org/docs/latest/api/process.html#process_process_argv). Using inspect-brk ensures that Node pauses the spawned process at its first line, giving me time to connect the debugger without missing any execution output.
I chose port 7000 for the parent process to avoid the default. After applying the patch, I ran the command with the designated port.
$ node - inspect-brk=:7000 index.js
Setting up Chrome
Next, I had to inform Chrome which ports to look for. Since my patch passes ports in the range 700**1**-700**9**, I needed to add that range to the debugger configuration. Open chrome://inspect and click on the Configure button:
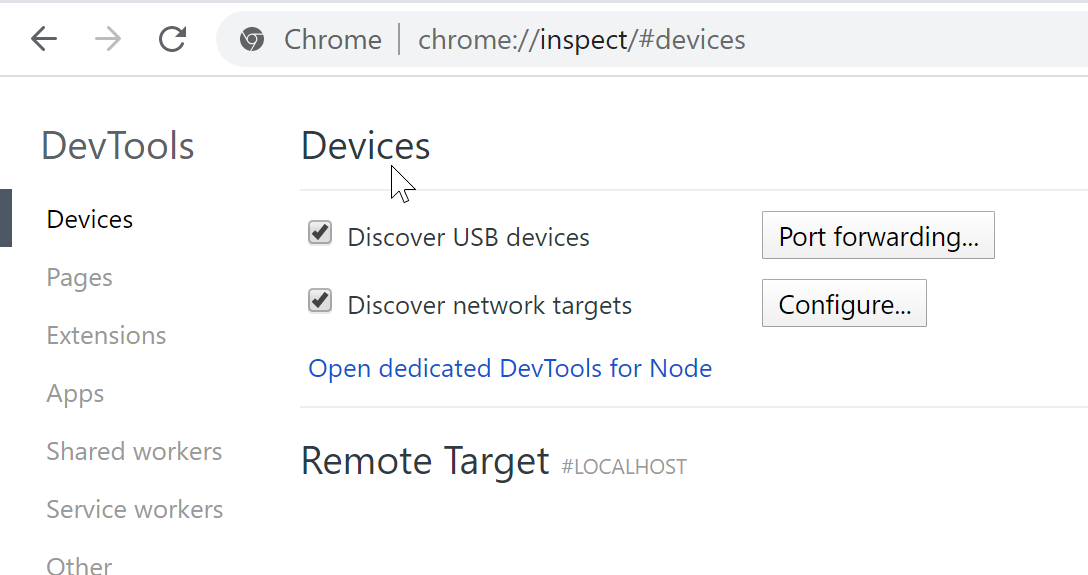
Then, add the ports individually:
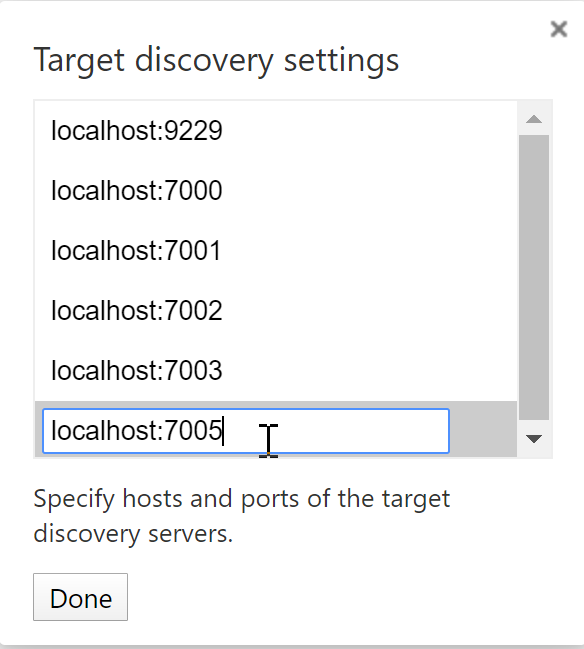
You can only add one port at a time, and you'll need to reopen the dialog for each entry. A simpler path, though, is to log the chosen port directly from the patch, so you only have to configure that single port in Chrome.
With port 7000 added, the parent process became visible in the list.
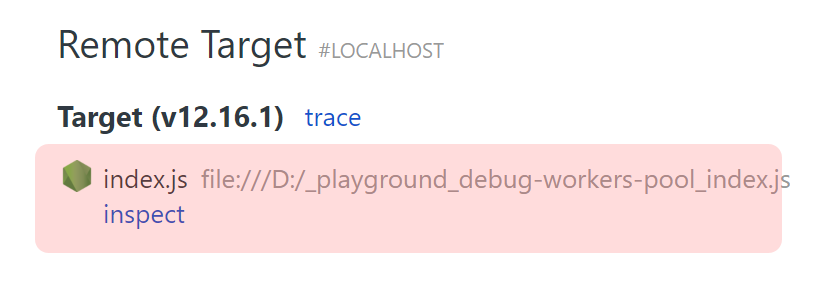
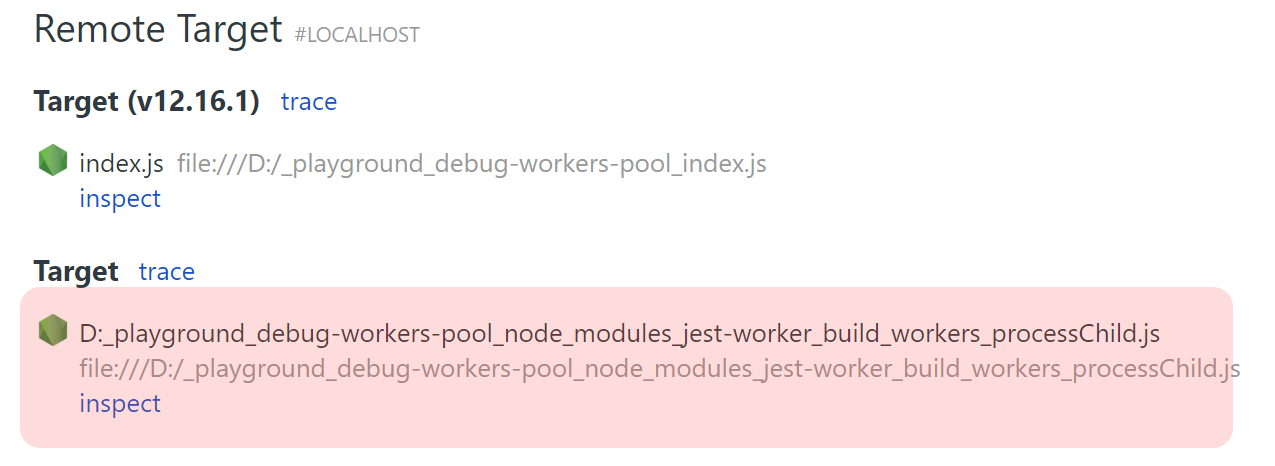
After attaching the debugger and letting it run, a new child process showed up, just as I had predicted.
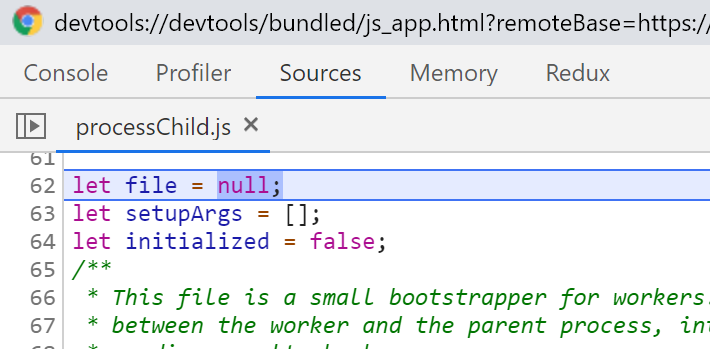
Clicking inspect opened Chrome DevTools, which had paused the process inside the child_process module.
When I resumed execution, the debugger finally stopped at my breakpoint inside the hello function.
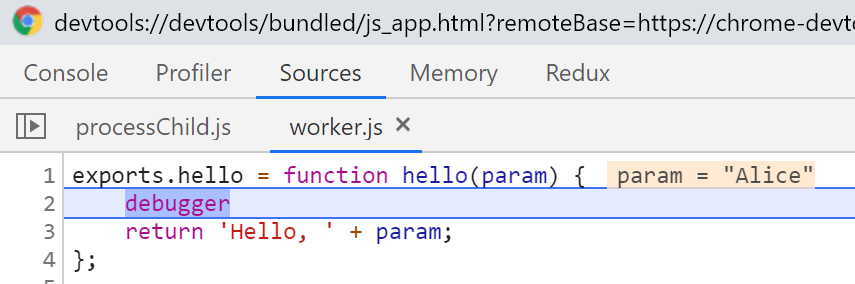
This outcome was exactly what I anticipated, triggering that satisfying rush of dopamine. There's always a great sense of achievement when you crack a tricky problem and make a fascinating discovery.
Modifying `jest-worker` within Gatsby.js
Once the standalone app was successfully patched, I knew the identical approach would work for jest-worker in my Gatsby setup.
To get child process debugging working in Gatsby, open node_modules\jest-worker\build\workers\ChildProcessWorker.js in your project and insert the same snippet from earlier:
Under normal conditions, jest-workers launches as many child processes as there are CPU cores detected by the system. This can be verified via the os module:
const os = require('os')
console.log(os.cpus().length)
In my case, the machine reported 8 CPU cores.
Yet when I checked chrome://inspect after starting the process, I found only four children instead of expecting eight:
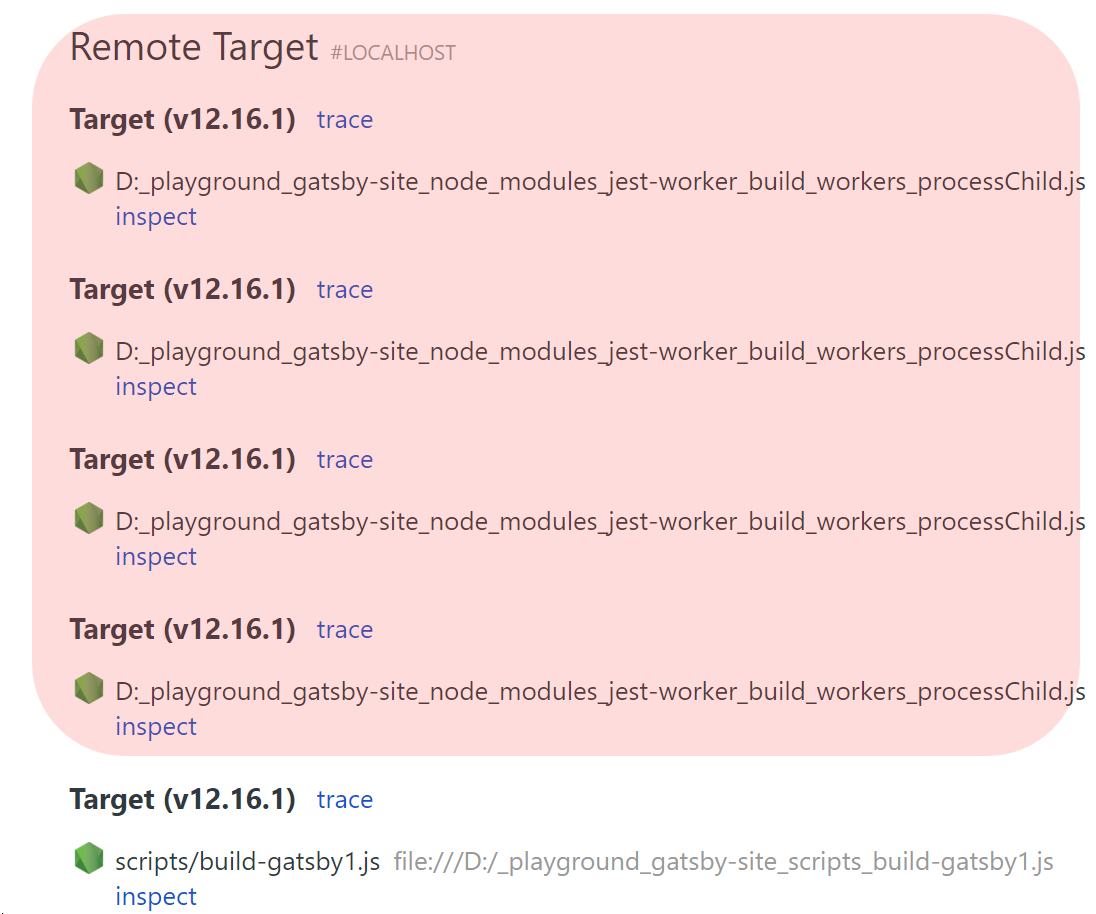
My conclusion was that the port numbers, generated from the interval [1–10], were likely colliding—one instance would take over the port from another. If you want to see every process, widening the port range reduces the chance of collision. Since adding all those ports to Chrome might not be practical, an easier way is to simply log each port and only attach the ones the Node inspector actually uses.
Still, when it comes to Gatsby child process debugging, I’d advise limiting yourself to a single child process so you don’t have to configure Chrome with a whole range of IP addresses. Head over to node_modules\gatsby\dist\utils\worker\pool.js and add this:
const create = () => new Worker(require.resolve(`./child`), {
  // numWorkers: cpuCoreCount(true),
  numWorkers: 1,   <---------- specify the number of child workers equal to 1
  forkOptions: {
    silent: false
  }
});
One more thing worth noting: you have to select the process that’s actually handling the build for the page that your component lives on. If you pick the wrong one, the breakpoint won’t fire even if other child processes are running. You may have to cycle through several before hitting the right one. For me, it was the third attempt that finally paused on the expected line:
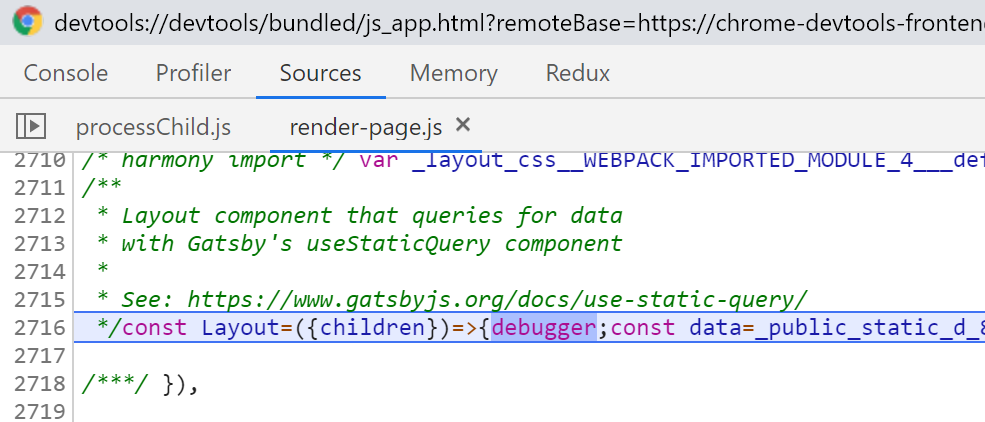
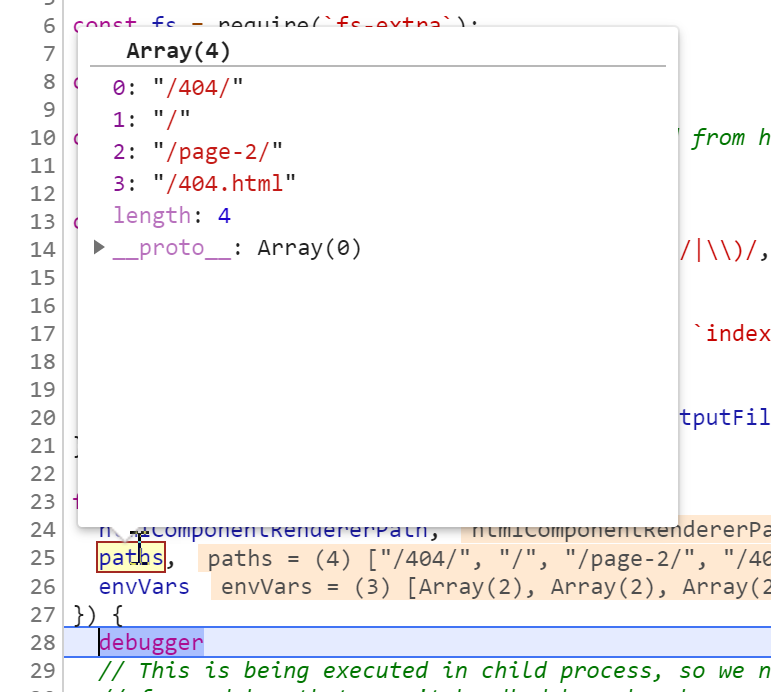
A useful tip—inspect the paths variable inside the renderHTML function in node_modules\gatsby\dist\utils\worker\render-html.js. to see exactly which page is being processed:
If you want to stop on every file, drop a breakpoint there unconditionally. To target a specific page, use a condition such as:
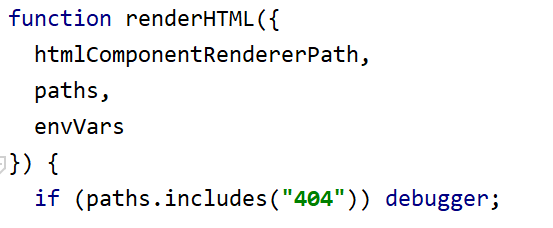
Or try a conditional breakpoint.
Best of luck with your debugging! For questions or feedback, feel free to join the discussion on indepth.community.